A quick refresher: What is El Niño and how can it affect global weather patterns?
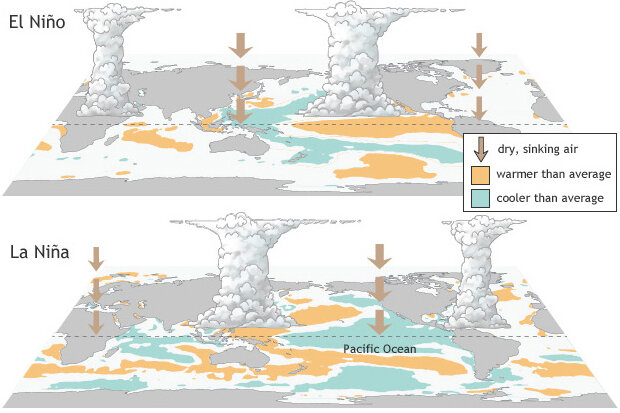
El Niño is the warm phase of the El Niño-Southern Oscillation (ENSO), a semi-regular recurring cycle that transfers vast amounts of heat and momentum from the tropical Pacific to the global atmosphere. It is triggered every 3–7 years when the prevailing easterly trade winds weaken or reverse, allowing warm water from the western Pacific to surge eastward while suppressing the vertical upwelling of cool water typically found off the coast of Peru.
When this occurs, and especially when full reversal of the easterly winds (known as “westerly wind bursts”) take place in the equatorial region, warm water from the West Pacific begins to “slosh” eastward (via oceanic equatorial Kelvin waves). Simultaneously, or shortly thereafter, cool water upwelling in the far east Pacific begins to weaken or disappear entirely–allowing surface waters to warm dramatically. The combination of eastward-propagating warm water and the reduction/elimination of local cold upwelling yields a rapid and sometimes dramatic transformation of the tropical east Pacific–from a conspicuous global tropical “cool spot” to one that more closely resembles its warmer tropical ocean counterparts elsewhere.
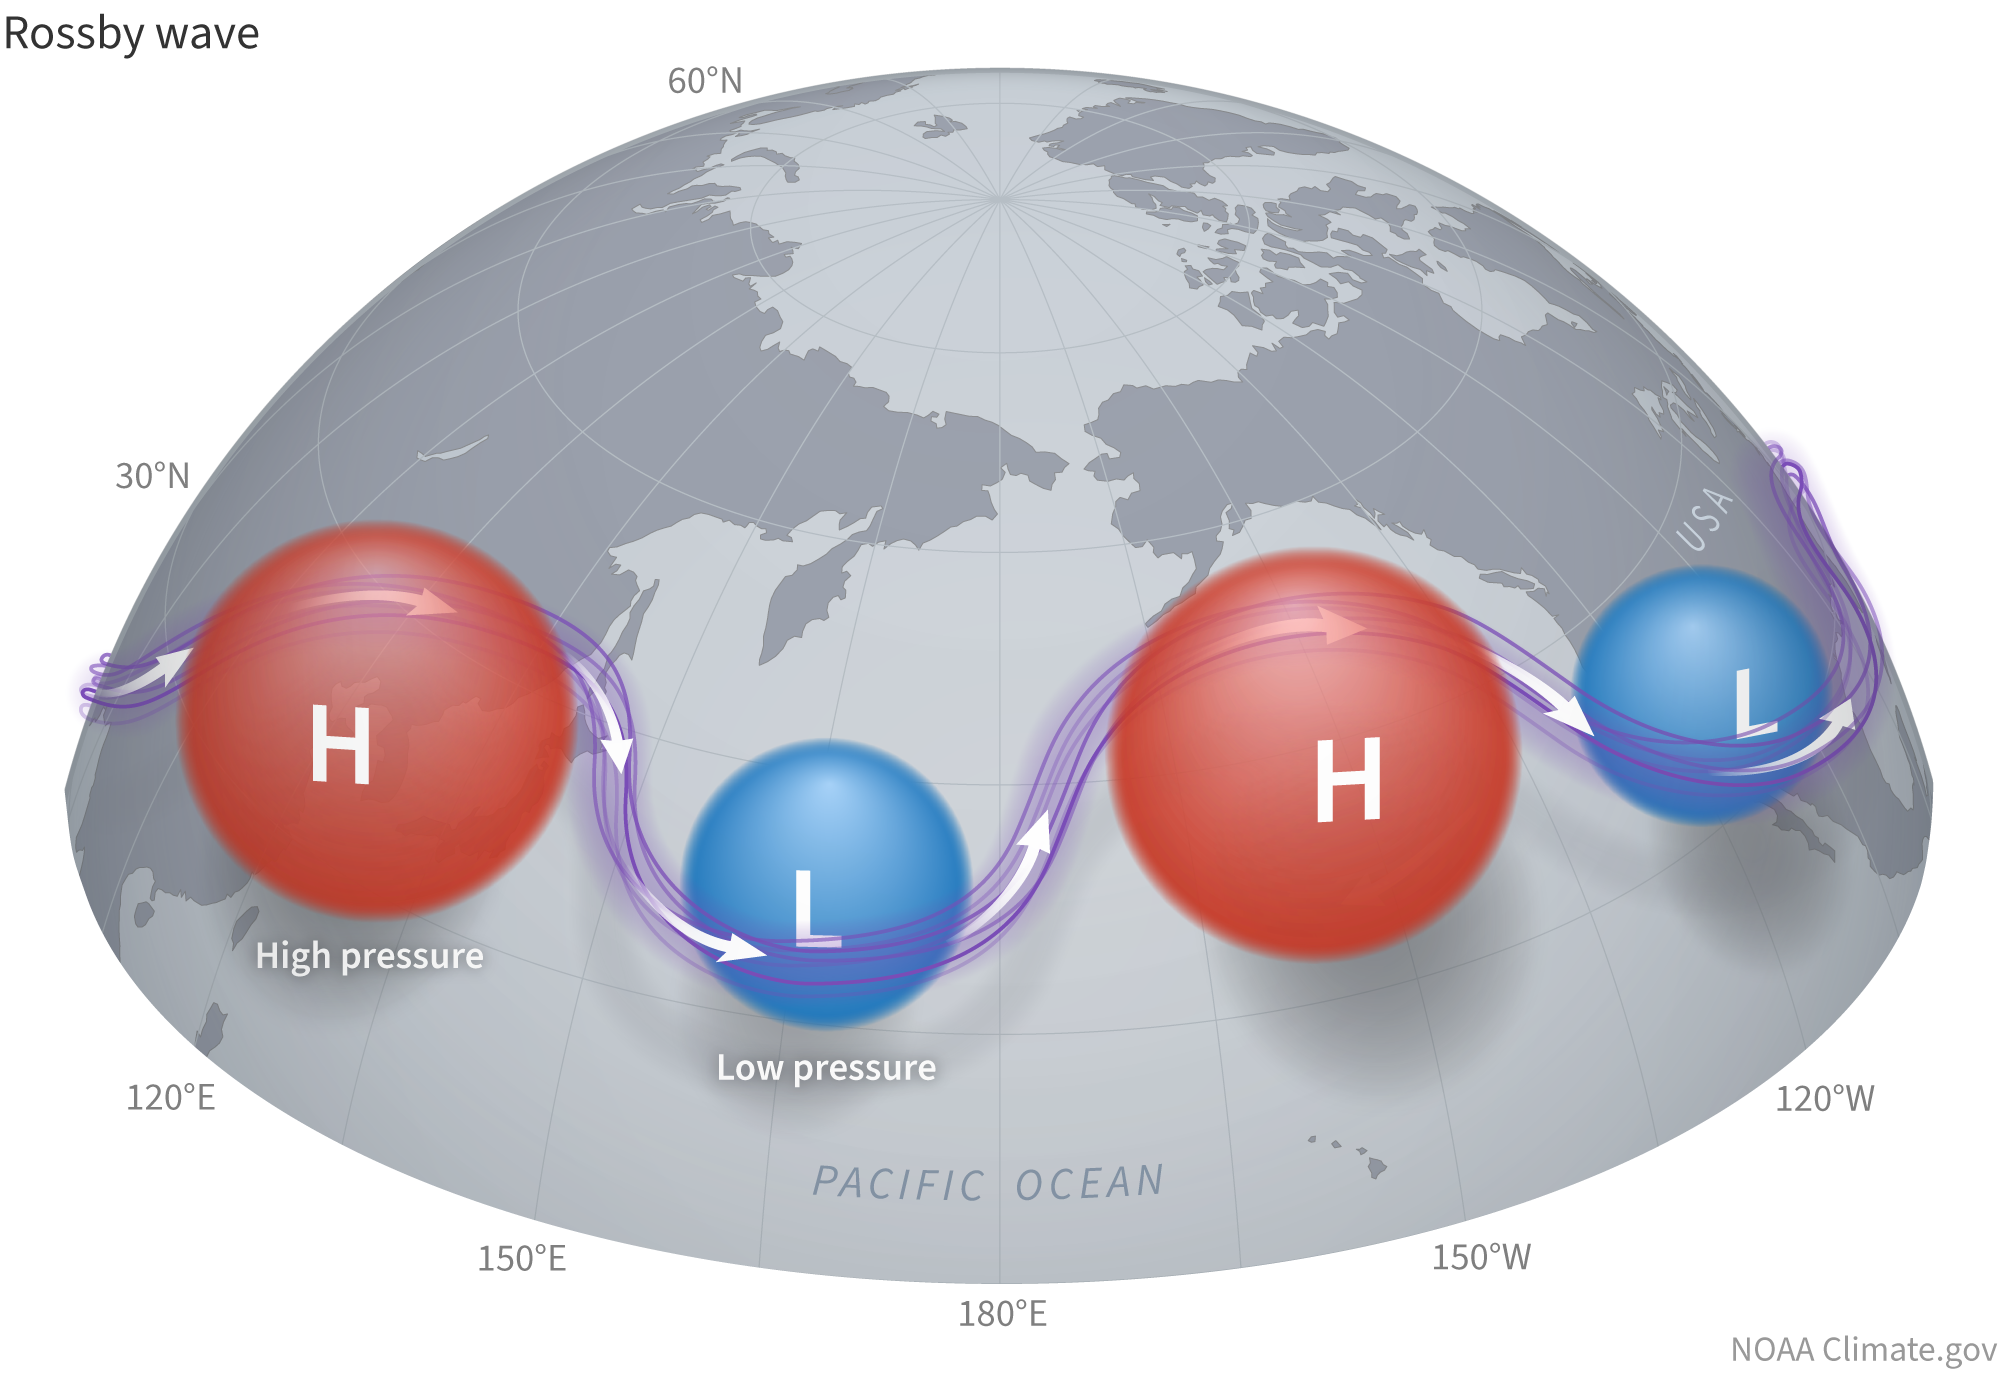
Episodic warming from El Niño episodes certainly has major local effects in and near Peru, but is far better known for its cascading and ultimately global-scale effects on global weather and climate. By shifting the primary region of vigorous tropical thunderstorm development in the Pacific basin up to thousands of miles east of its usual maximum in the west, El Niño can profoundly shift the source region for wave-like undulations (known as Rossby waves) in global upper atmospheric (jet stream) wind patterns–altering their strength, spatial patterns, and thus weather patterns across essentially the entire planet. Some regions see weather pattern shifts that favor increased rainfall and flood risk; others see shifts that favor decreased rainfall and increased drought and wildfire risk.
El Niño also acts as a “thermostat” for global climate by liberating years’ worth of accumulated heat stored in the subsurface tropical Pacific Ocean and dumping it into the atmosphere, where it eventually dissipates–but not before warming the entire planet in the meantime. Thus, El Niño raises global average temperatures temporarily–acting, essentially, as a 6-12 month long “mini global warming” event. But crucially, the warming from El Niño and warming from human-caused climate change are additive: In the late 2020s, El Niño’s temporary warming influence (+0.2°C–0.4°C) will occur atop an existing (and essentially permanent) +1.4-1.5°C baseline of human-caused warming.
The current forecast: High odds of a historically significant El Niño event in 2026
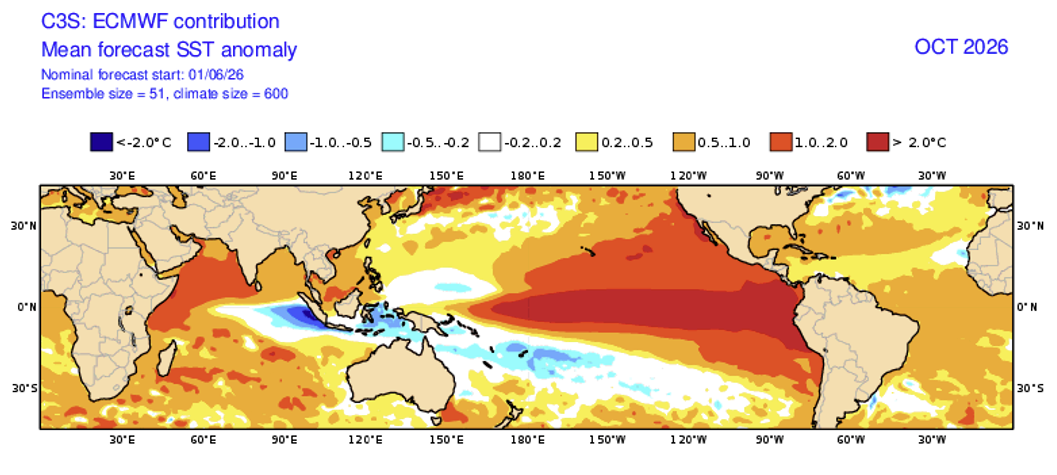
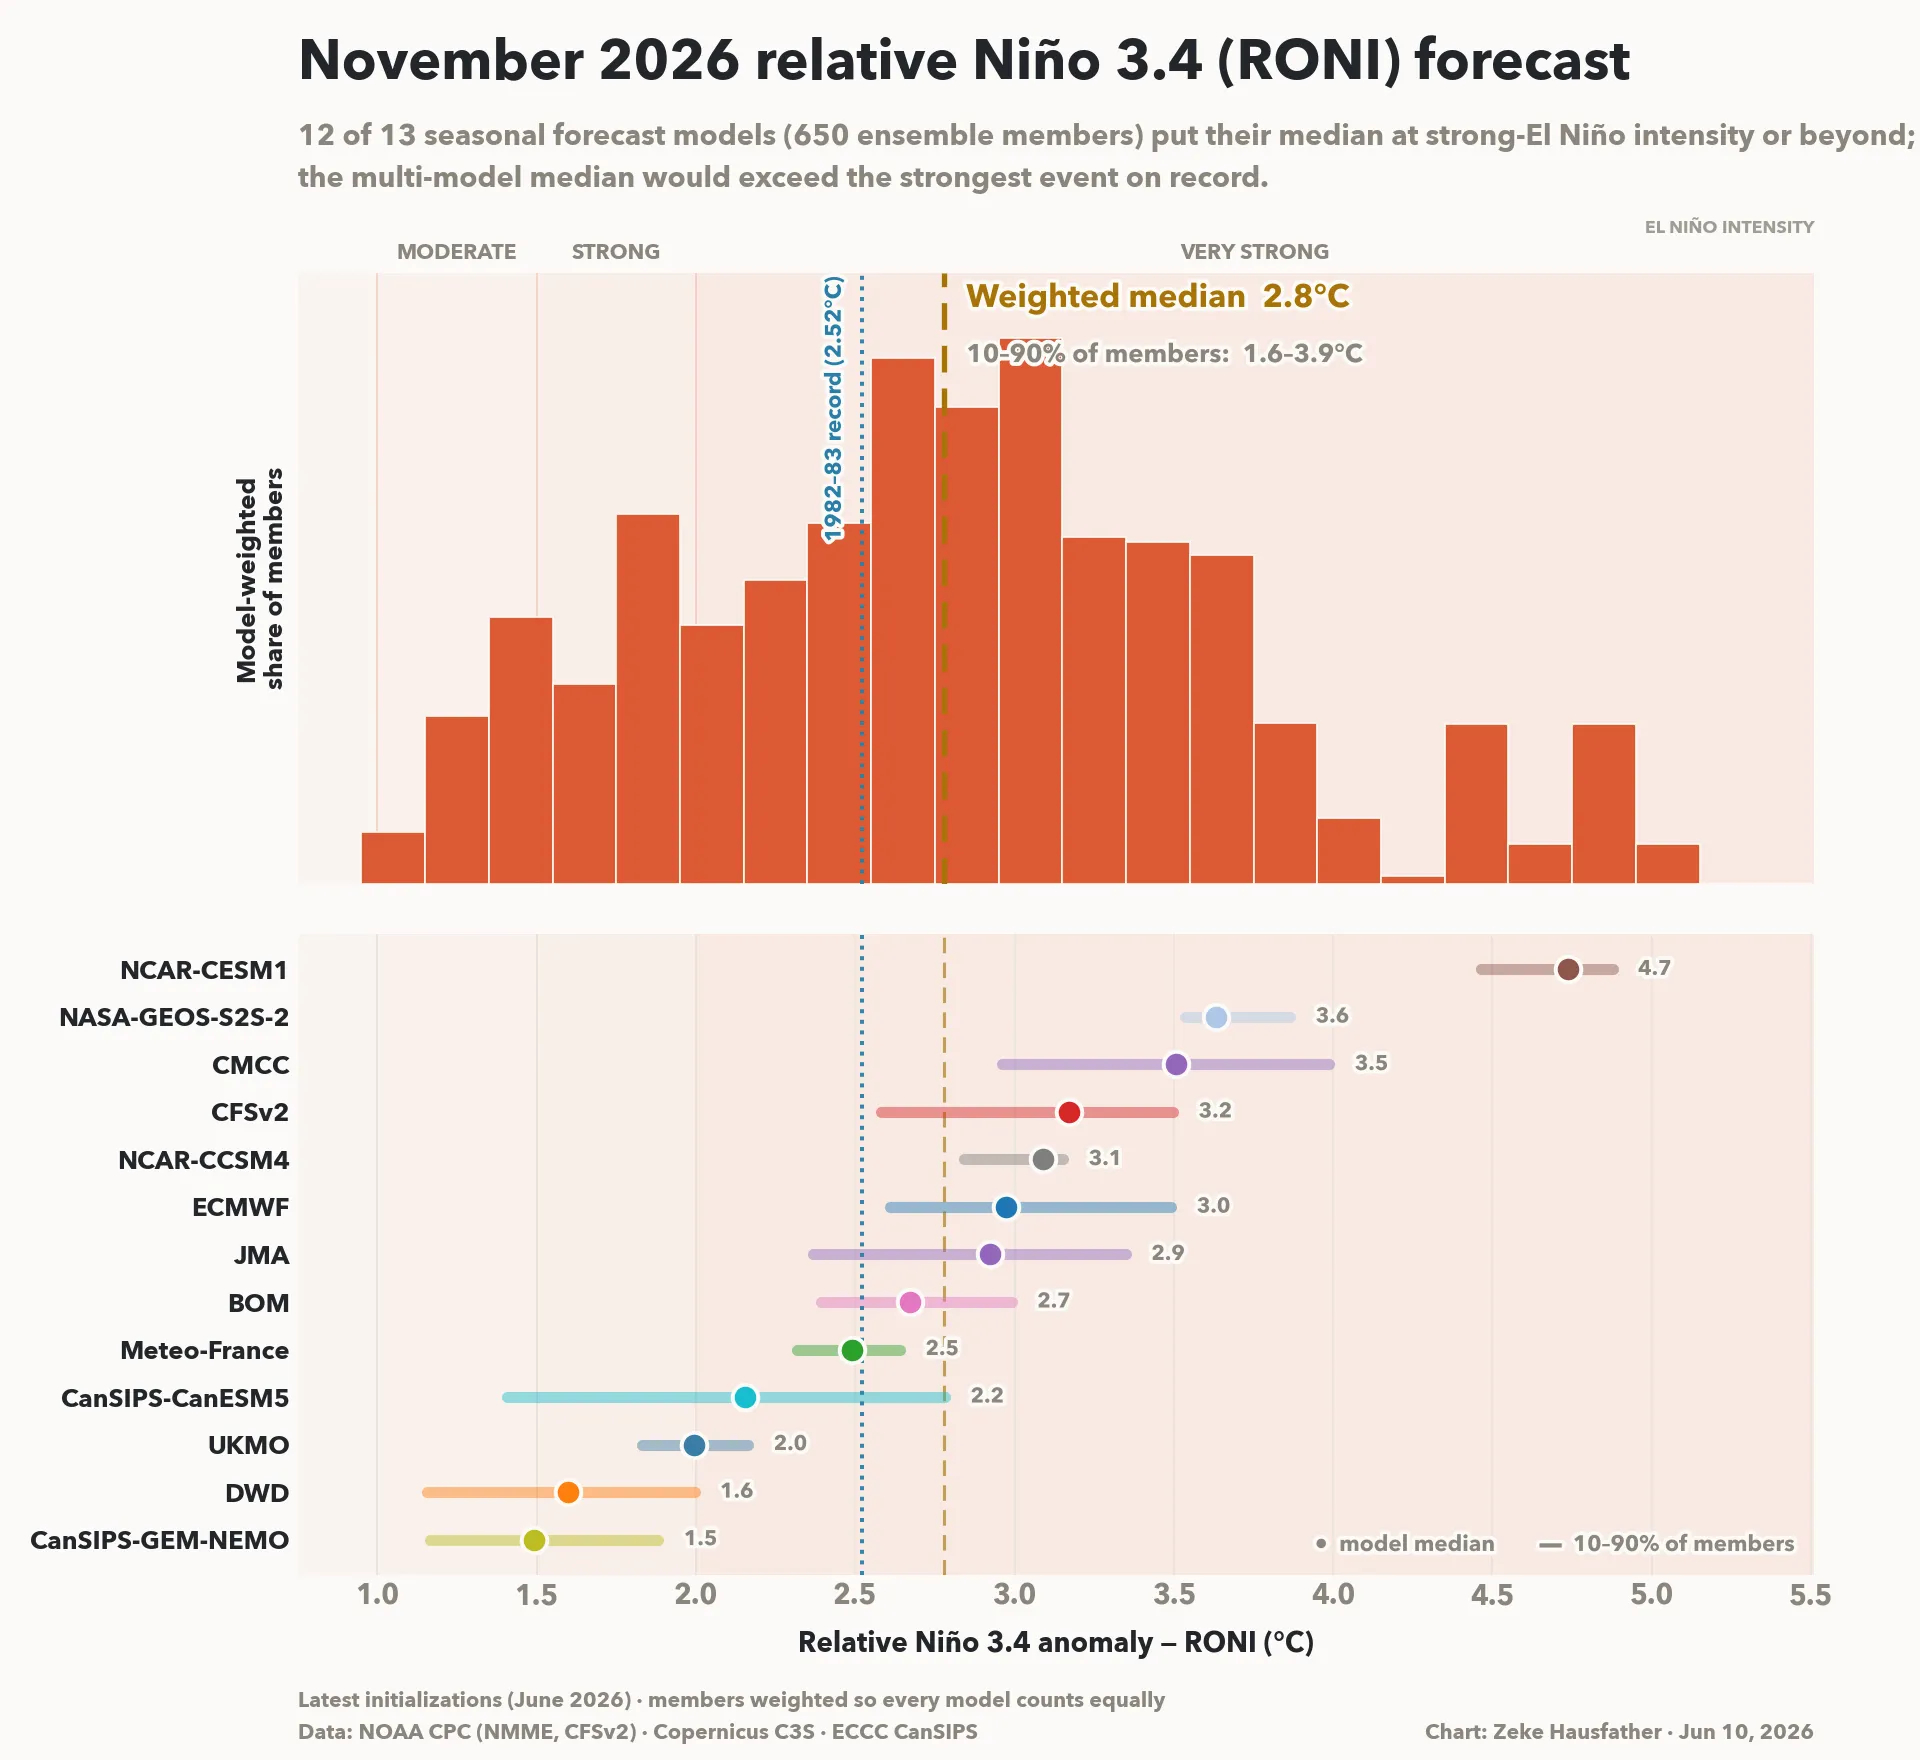
As we emerge from the so-called Spring Predictability Barrier, multi-model ensemble predictions have become even more aggressive and are now explicitly predicting an El Niño of very strong, and quite possibly record-breaking, magnitude by autumn or early winter. In fact, the just-released multi-model “superensemble” predictions for June are nothing short of remarkable, with the median forecast from every single international model ensemble depicting at least a “strong” event, and the majority indicating a top-tier, very strong-to-historic event. This is true using both the traditional and the newer “relative” El Niño index (or “RONI,” which is designed to more accurately reflect El Niño magnitude in a warming climate by removing ocean temperature differences arising from long-term trends). And the latest official forecast update from NOAA is consistent with these model predictions: It not only confirms that, as of June, El Niño is already underway, but also indicates nearly 90% odds of an event reaching at least “strong” intensity and over 60% odds of a “very strong” event.
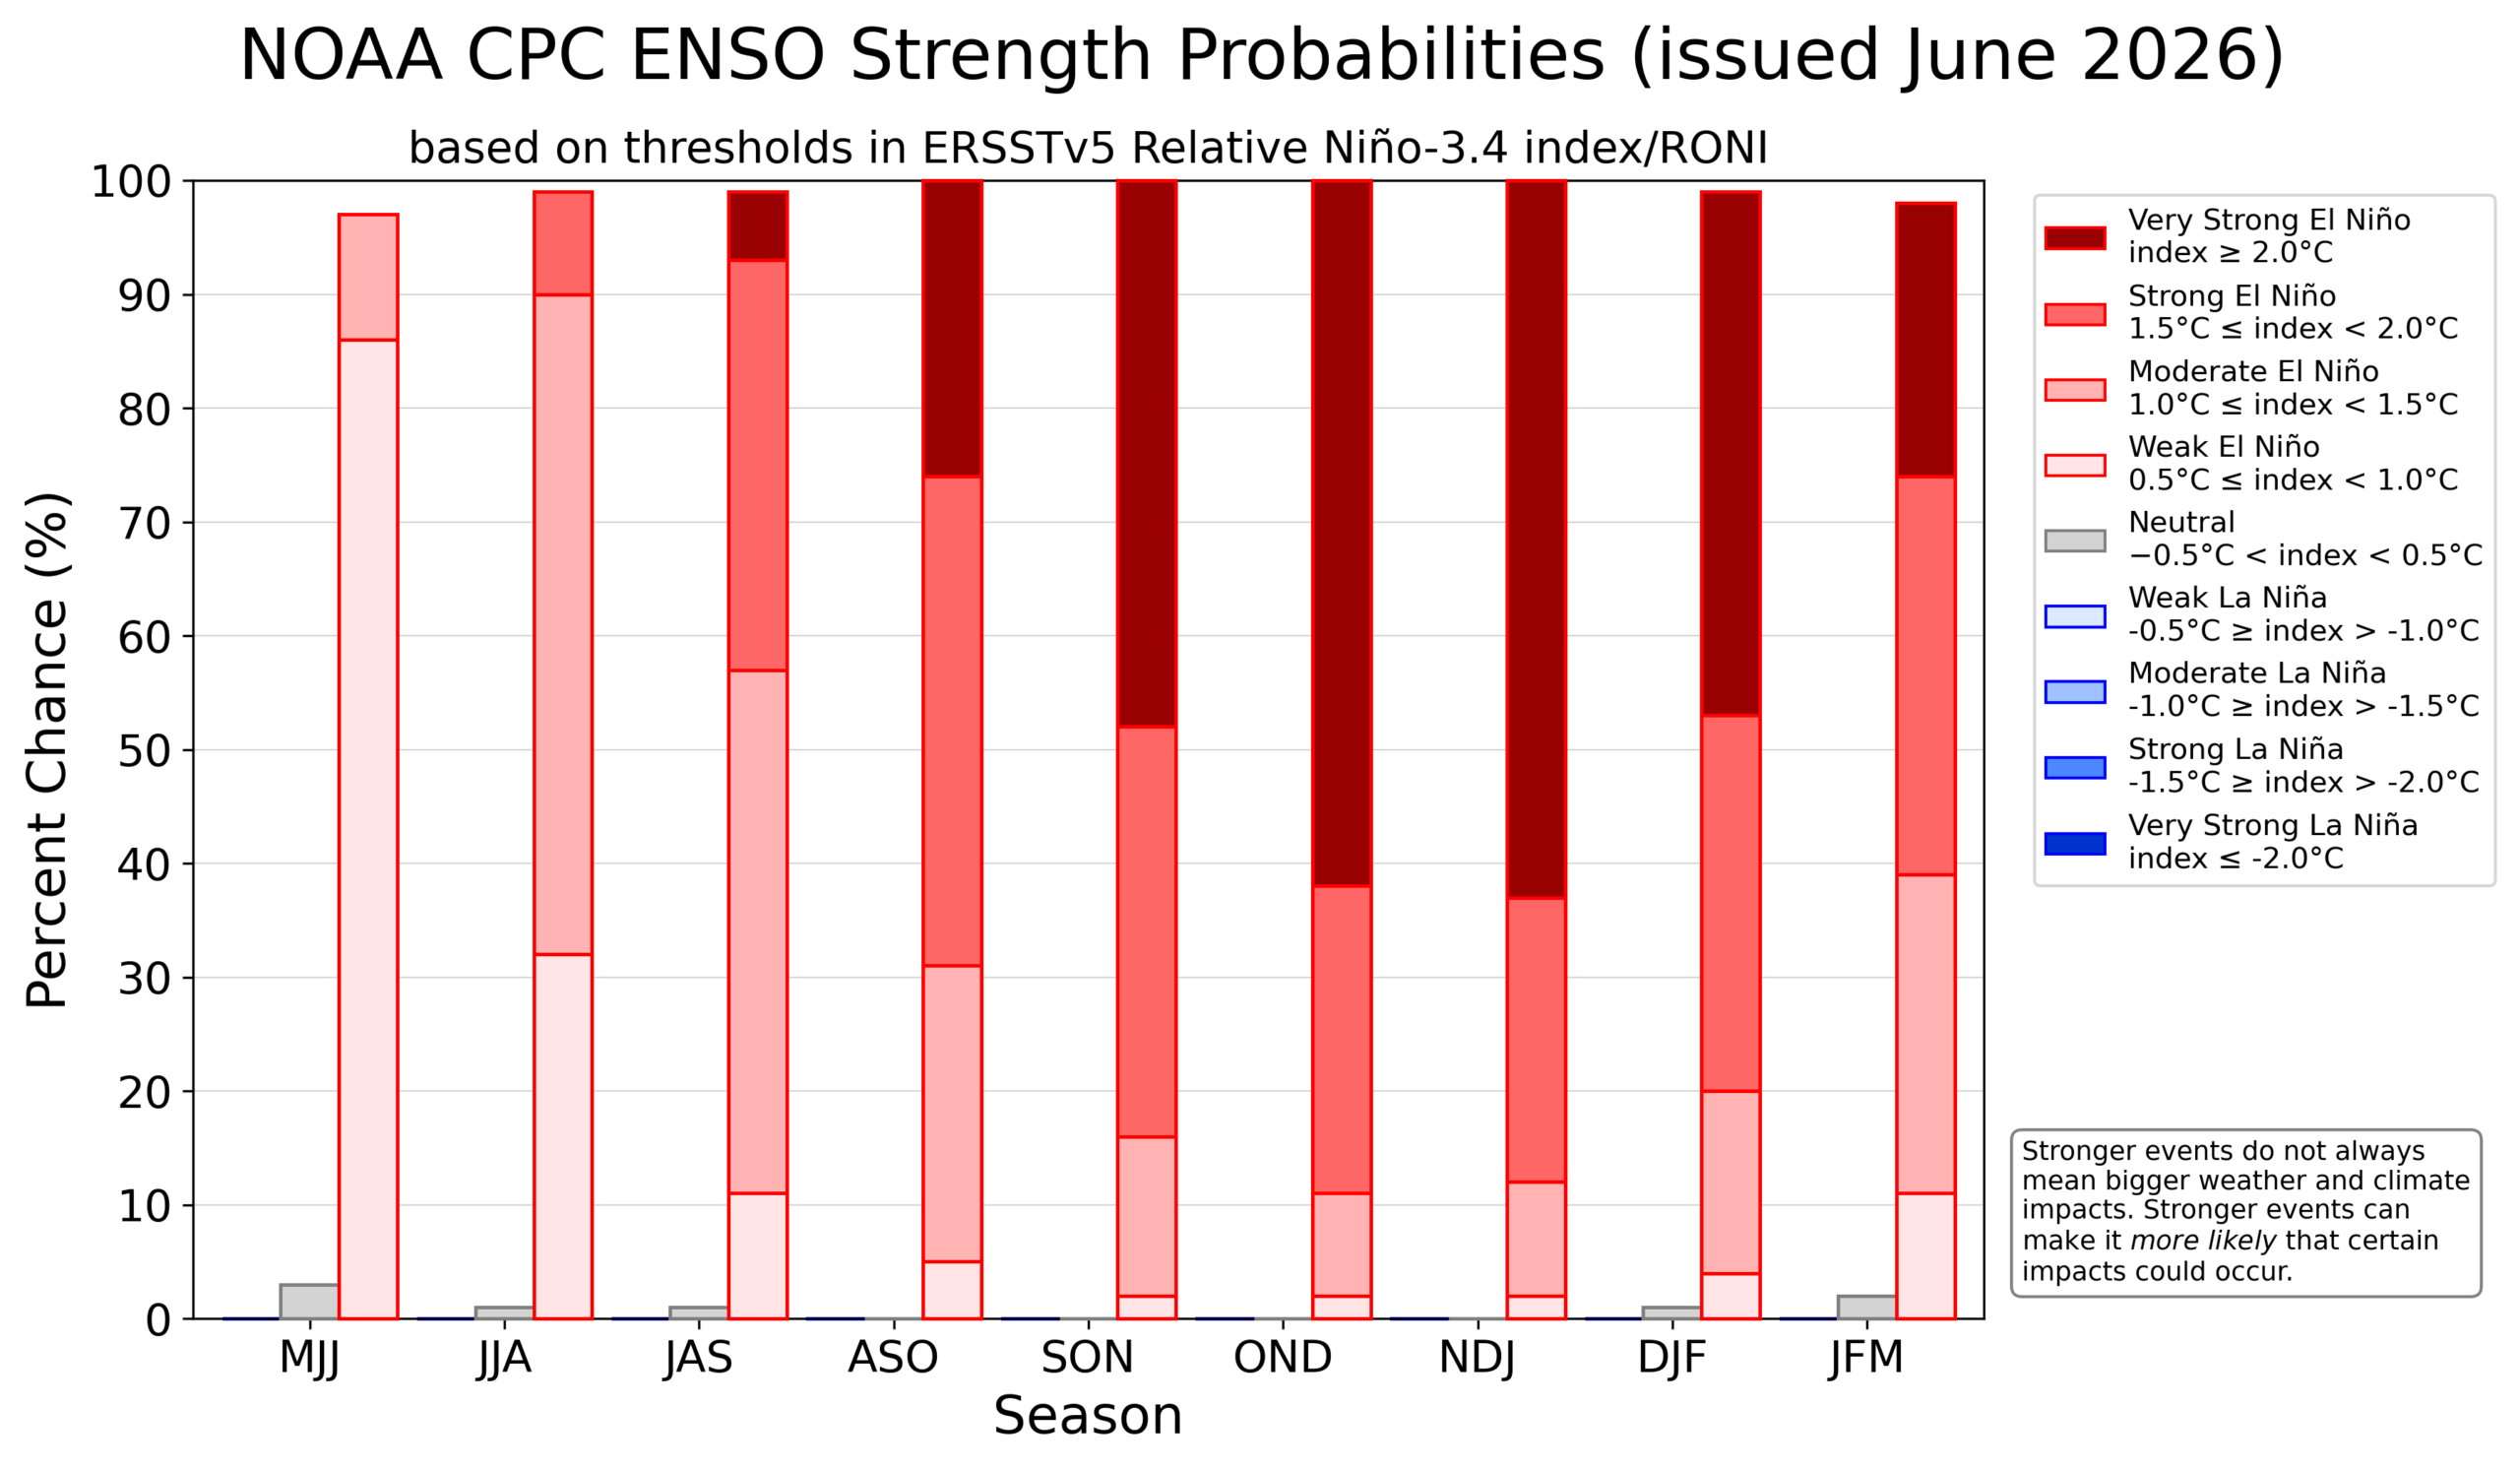
In other words: the single most likely outcome by autumn or early winter 2026-2027 is a very strong, or so-called “Super,” El Niño event.
(A quick note regarding terminology: “Super El Niño” is simply a colloquial term used to refer to “very strong” El Niño events–i.e., those which are among the top 3 or 4 events in the reliable satellite record dating back to the late 1970s and characterized by an ONI/RONI value of +2°C or above. Its use does predate the social media era, and my perspective is that it’s perfectly reasonable to use the term in the present context since that is indeed what the current forecast portends. In this post and elsewhere, I’ll use “very strong” and “Super” El Niño interchangeably.)
Are there breathless news headlines and dubious social media posts floating around that may be exaggerating the severity or definitiveness of outcomes with respect to El Niño in 2026? Sure; there’s no question. But the recently observed and ongoing rapid escalation of conditions in the tropical Pacific, plus the consistently and increasingly extreme forward-looking model projections, truly do suggest that something extraordinary could unfold in the global climate system later this year. Will it break specific historical records? Neither I, nor anyone else, can say for sure at this stage. But is it possible the Earth could experience the strongest El Niño of the modern era within the next six months against the backdrop of preexisting historically unprecedented warmth amid the long-term warming trend? Absolutely–and it is now time to be discussing the potentially large regional-to-global scale implications.
Summer & autumn implications of a strong-to-extreme El Niño event for California and the U.S. West
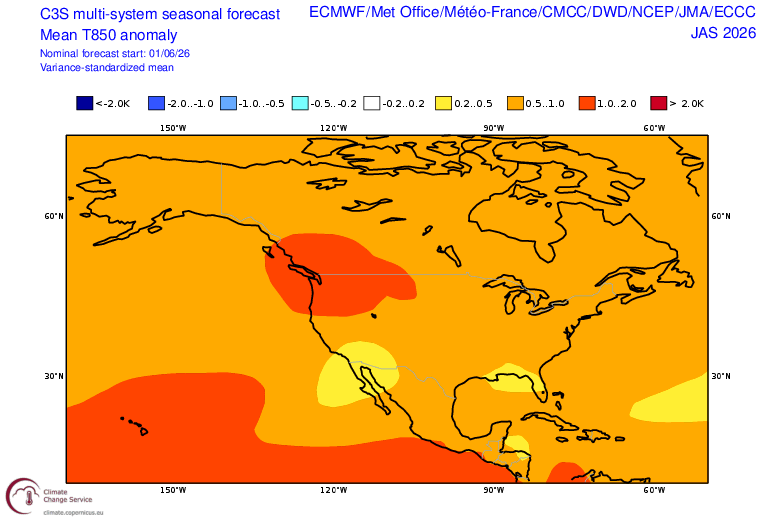
At present, an already long-duration marine heatwave has been ongoing across much of the northeastern subtropical and mid-latitude Pacific Ocean since mid-late winter. For much of this period, these highly anomalously and in many cases record-breaking warm ocean surface temperatures have extended all the way to the Pacific Coast, including California. In recent days, persistent northwesterly flow has induced a narrow corridor of cold water upwelling along the immediate California coast from about San Francisco northward to Eureka, but elsewhere ocean temperatures remain greatly elevated.
Up through early June, this marine heatwave—primarily driven by a positive Pacific Meridional Mode (PMM)—has been unrelated to El Niño. However, because PMM+ phases in spring often precede El Niño onset, its current trajectory is consistent with historical patterns.
The most obvious effect? Well, it will be warmer and more humid than usual along the immediate West Coast (with that warm and moist influence spilling inland through gaps in coastal terrain). But this heat won’t necessarily manifest as extremely hot daytime temperatures–instead, it’ll likely stem from an elevation of “baseline” warmth. Nights will be considerably milder than usual, and afternoons may feel increasingly “muggy” as the summer progresses. In places like Los Angeles and San Diego, downright tropical dewpoints may be possible by August and September. Should a major heatwave occur during this period, its human health impacts may be greatly elevated relative to usual given the vastly greater physiologic challenges associated with humid heat (versus California’s more typical dry heat).
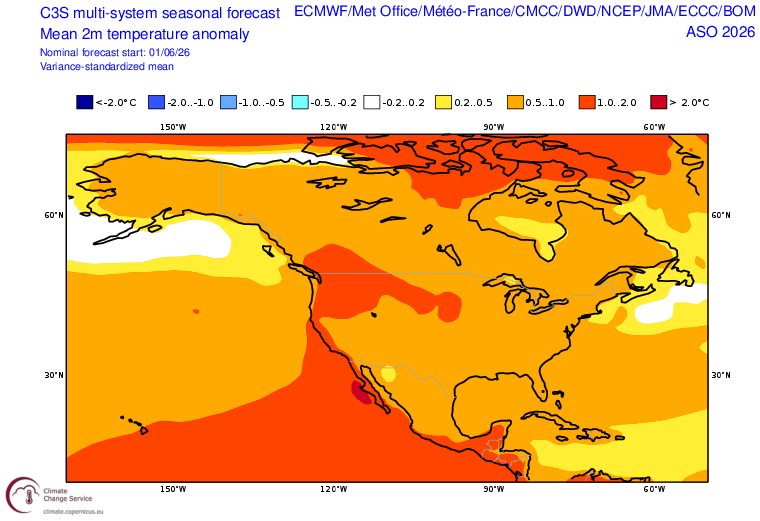
So although these very warm ocean waters will not necessarily increase the likelihood of extreme afternoon high temperatures, they will greatly increase the odds of a warmer-than-average summer overall and also the risk of dangerously high humidity during any late summer or autumn heatwaves that do develop. The risk of humid heatwaves will also be higher than usual across most of the interior of California and the West within several hundred miles of the coast, though the most pronounced elevation will likely be in SoCal.
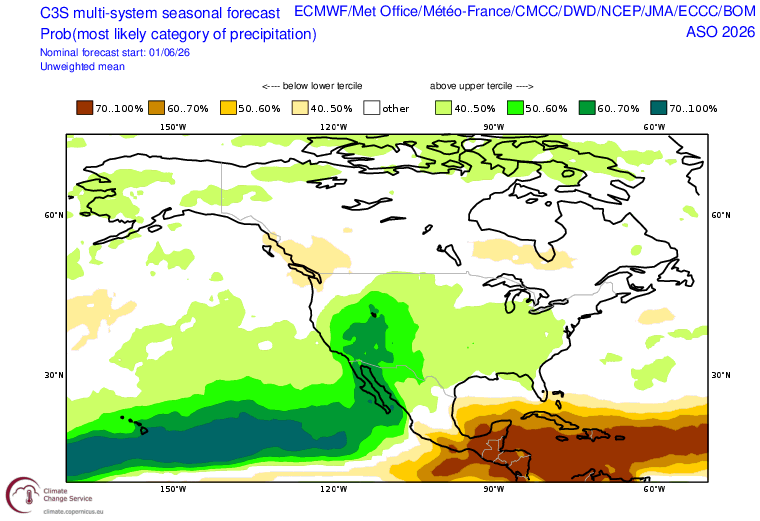
These highly anomalously warm Pacific ocean conditions will also bring some other potentially significant impacts. In addition to increasing near-surface humidity near the coast, these warm SSTs will also allow the amount of water vapor in the overall atmosphere to be considerably higher in this region. Since mid-late summer coincides with the peak of the North American summer monsoon, which brings widespread thunderstorm activity and often significant precipitation to the Desert Southwest and interior mountain areas, this added moisture could well give this year’s season a boost. In fact, warm SST in this region tends to give a preferential boost to monsoonal precipitation specifically on the central and western fringe of the usual monsoon zone–which typically extends, at least discontinuously and occasionally, over California.
Thus, in addition to boosting odds of a robust summer monsoon across the mountain and desert interior, there will likely also be an increased chance of anomalous convective activity (i.e., showers and thunderstorms) across California. And recent modeling suggests this might well extend beyond the usual mountain and desert areas to encompass valley and coastal regions, especially in southern California but also elsewhere.
There is one additional consideration regarding the summer and autumn pattern and greatly elevated tropical/subtropical Pacific ocean temperatures–and that relates, believe it or not, to tropical storm and hurricane activity. Strong El Niño years often see an increase in East Pacific hurricane activity due to a combination of increased “fuel” (via elevated water temperatures) and decreased “inhibition” (via decreased vertical wind shear), and this year will likely follow that pattern. So there will almost certainly be more East Pacific hurricanes than usual this year, and many of them might be stronger than usual as well.
Now, from a California and Southwest U.S. perspective, there are multiple barriers that help explain why the region (almost) never sees direct impacts from tropical storms or hurricanes. First, the water is generally just too darn cold–even several degrees of warming yield an environment that is still simply too chilly for hurricanes to develop, or even maintain their strength, near California. Second, prevailing easterly winds tend to blow developing hurricanes out to sea–sometimes hitting southern Baja California before heading toward Hawaii, but rarely turning northward. And third, the atmosphere is also quite stable most of the time near California: the marine layer inversion, plus dry and warm air above it, usually acts as a poison pill that helps to rapidly disintegrate any nearby tropical systems.
But…during a potentially very strong El Nino year amid a climate-warmed baseline, at least two of these barriers might weaken somewhat. Warmer ocean temperatures, while still far too cool for outright tropical cyclogenesis, are slightly less hostile than usual. Increased atmospheric water vapor and near-surface instability, too, can offer a less overtly unfavorable environment as well. And while prevailing easterly winds will still be present and steer most systems well offshore, there are usually at least a couple of brief windows in late summer or autumn when a period of transient southerly flow would allow a closer approach from a decaying tropical storm or hurricane (if one happens to be be present at the time).
The primary impacts in California and the Southwest from such events historically have been from heavy rainfall and flash flooding, and also from thunderstorm activity (which has caused both flooding and wildfire ignitions, depending on the amount of rainfall and extent of pre-existing drought). These would be the most likely outcomes from any northeastward-recurving tropical storms or hurricanes this year–and the odds of one or more such events will be elevated considerably above baseline in late summer/autumn 2026.
But it is worth noting that there have been some true “near misses” historically (including most recently with former Hurricane Hilary in 2023 and former Hurricane Dolores in 2015, and more distantly, Hurricane Linda in 1997). Additionally, a tropical storm-strength system made landfall near Long Beach in 1939, and a hurricane-strength system likely made a close approach on San Diego way back in 1858.
In any given year, even this one, the absolute odds of a direct tropical storm or hurricane landfall in California remain very low. But they are decidedly not zero, and the odds will be notably elevated (in a relative sense, at least) during a year with ocean and atmospheric conditions like those currently being depicted in ensemble-based model outlooks for Aug-Oct 2026. So this is an “edge case” possibility I’ll certainly be following, with interest, in the months to come.
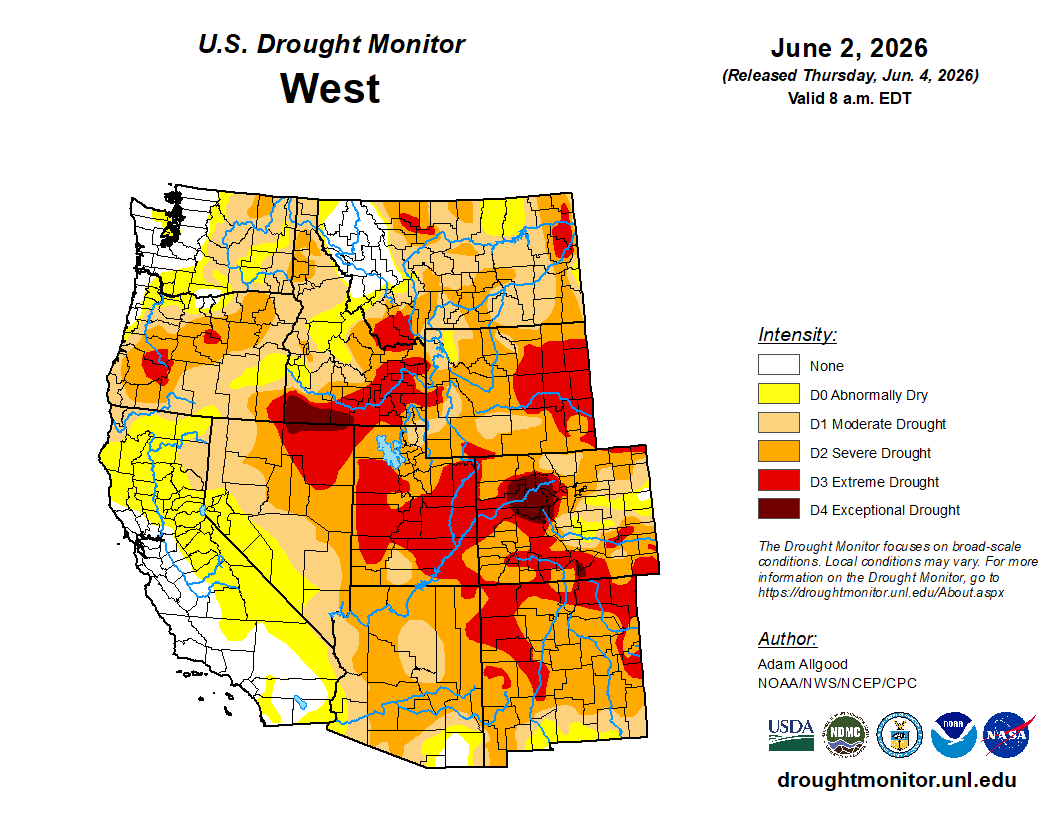
There is one other potential item of note regarding this summer in the West, and that is the elevated potential for significant Pacific Northwest heatwaves. Unlike in California and the interior Southwest, where summers during developing significant El Niño events do not necessarily feature unusually strong atmospheric high pressure aloft (and instead are warmer than average due to elevated baseline ocean temperatures, as noted above, plus long-term warming), the odds of amplified or “blocking” high pressure systems in the Pacific Northwest is considerably higher during El Niño summers and autumns. That means that the odds of major heatwaves and fire weather events may be especially high in this region later this summer, and this could spell wildfire-related trouble given widespread drought (especially in Oregon). There is less of a precipitation signal in this region during summer versus the clearer wet signal in the interior West, but the potential for high heat plus significant and widespread antecedent drought offers a potentially consequential signal here.
Across the interior West–including the Great Basin and central/southern Rocky Mountains–wildfire risk will be greatly elevated during at least the first half of summer due to very severe drought and anomalous warmth. By mid summer, ongoing fire risk will likely be determined by whether widespread soaking rainfall from a robust monsoon arrives before, or after, the likely occurrence of drier thunderstorms following early summer heatwaves and wind events, which have the potential to ignite many fires in June or early July. And in California–one of the few Western U.S. locations not experiencing a significant drought at the moment–wildfire conditions later in the summer and autumn (which is usually peak season) will also depend on just how much anomalous summer precipitation occurs. If the region sees rare, but possible, soaking rainfall in Aug-Oct, it’s possible we’ll see a relatively modest peak and early end to fire season. But if those unusual summer/autumn rains don’t materialize, and/or if the warm nearby ocean or “tropical remnant” events instead facilitate dry thunderstorm outbreaks (versus rain-bearing ones, as occurred in August 2020 when over 650 fires lightning fires ignited in a single day), the potential is there for a very different, and more concerning, outcome. Small-scale but high-consequence weather events like these are impossible to predict months in advance, so this too will be something I’ll be tracking closely this summer.
Winter (rainy season) implications of a strong-to-extreme El Niño event for California and the U.S. West
In recent years, there has been a fair bit of public discourse centered on the links between El Niño and California rainfall–or the lack thereof. Personally and professionally, I’ve often found these conversations to be quite frustrating–because even widely cited sources often miss not only the real nuances involved, but also some of the most essential scientific realities.
So, what follows is my attempt to set the record straight–since we’re going to be hearing quite a lot about this in the coming months.
From a meteorological perspective, El Niño has the potential to influence California cool-season (i.e., November-April) precipitation primarily via two separate but related mechanisms. First, warming ocean temperatures in the eastern tropical Pacific (still thousands of miles from California) shift the preferred region of tall tropical thunderstorms (deep convection) well eastward across the basin. Localized latent heat released from these thunderstorms—like ripples radiating outward from a pebble dropped into a pond—sends wave-like atmospheric disturbances poleward, deepening the Gulf of Alaska low and forcing the polar jet stream southeastward, closer to California. Simultaneously, enhanced localized warming of the upper atmosphere in the tropics south of California (thanks, again, to latent heat release from deep convection) strengthens the poleward temperature differential–causing the subtropical branch of the jet stream to strengthen as well near California and across much of the southern tier of the United States. That, in turn, increases the persistence and intensity of wet and stormy periods during winter–or that’s how it works in a scientifically idealized world, at least!
In the real world, it’s more complicated. El Niño is never the only factor at play in any given season; other atmospheric and oceanic influences, from global warming to volcanic eruptions to the Pacific Decadal Oscillation (or even completely random “weather noise”) can either accentuate or offset El Niño’s influence. During weaker El Niño events, those other factors can and often do win out–and the El Niño influence becomes so weak as to be insignificant at seasonal scale. This leads to relatively weak historical correlations, especially when using observational data for specific locations where noise completely overwhelms the signal.
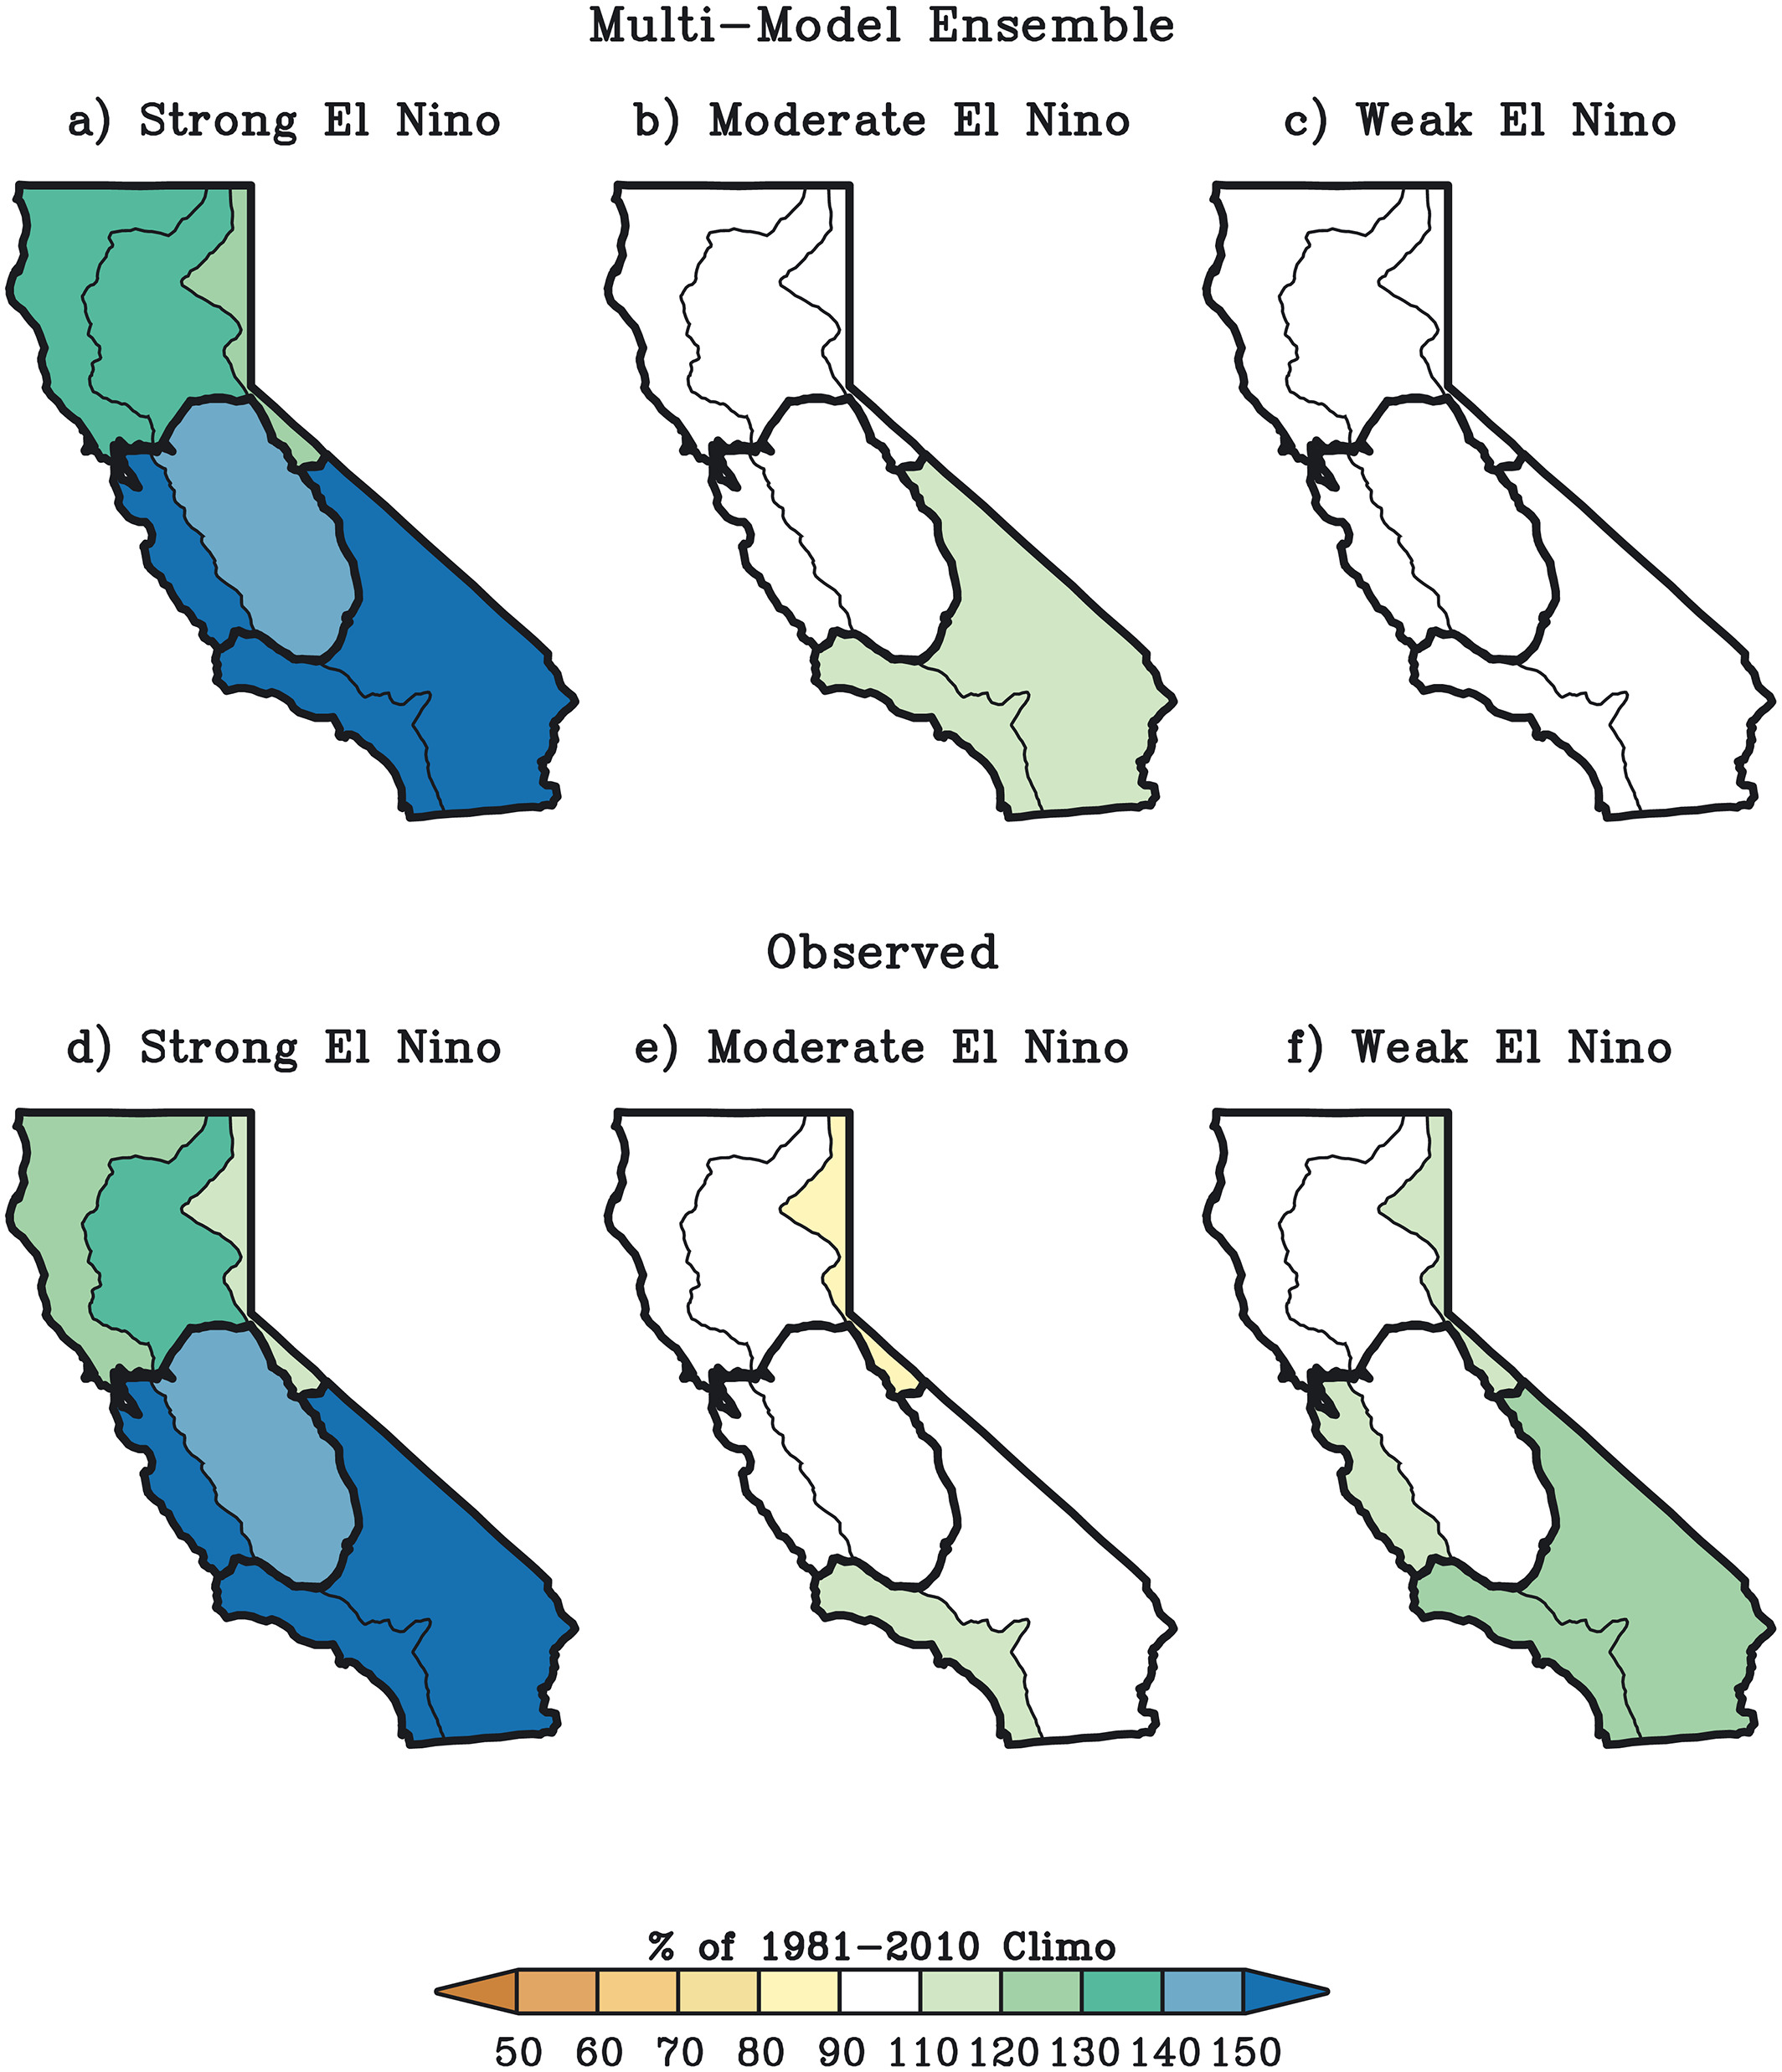
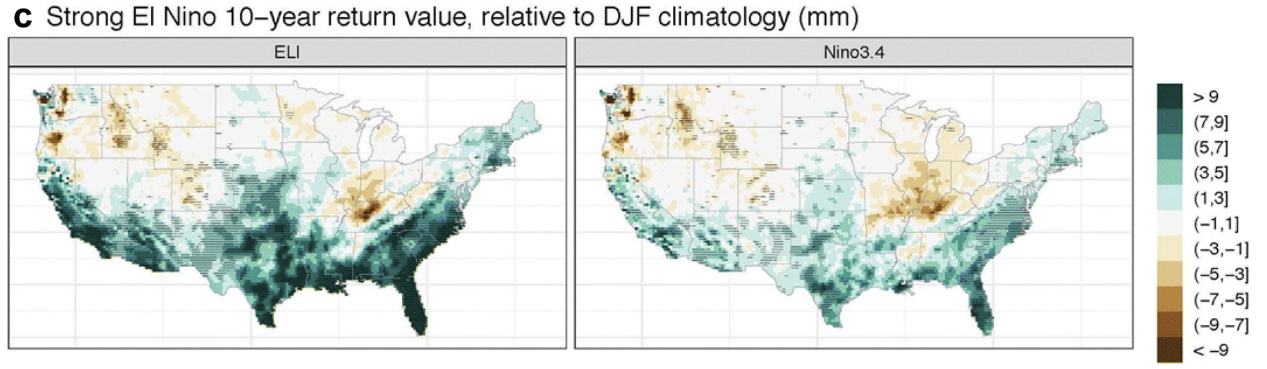
But when considering specifically strong or very strong El Niño events, the math changes considerably–and the signal does rise above the noise. For the strongest events, especially when using metrics that can account for the spatial characteristics of El Niño as well as its intensity, a clear relationship emerges: Big El Niño events significantly increase the odds not only of wet winters in California and the Southwest, but also specifically of extreme precipitation events and most likely flood risk as well. Additionally, the increased precipitation signal expands from being primarily in southern California (during weaker events) to encompassing essentially the entire state (during strong ones), as well as a broader swath of the Southwest.
This notable connection is not apparent when lumping El Niño events of all intensities together, and it’s also hard to fully glean solely from point-based observational data (since we’ve really only seen a handful of truly strong El Niño events in the modern record). That’s why it’s so important to consider the extensive published weather and climate literature on El Niño and California precipitation that goes beyond observations and simple correlations: Using process-based models, it’s possible to uncover relationships across many dozens of simulated hypothetical strong El Niño events, rather than just the handful we’ve witnessed in the last few decades. And such efforts paint a much clearer picture than do observational analyses alone.
Our own research reflects this. When considering new potential flood scenarios for the “ARkStorm 2.0” exercise, 7 of the top 8 physically plausible month-long meteorological storm sequences that served as candidates for the new scenario occurred during simulated moderate or strong El Niño events. As we reported in the associated peer-reviewed paper, “there is a substantially elevated likelihood of month-long storm sequences capable of producing very large precipitation accumulations during moderate to strong El Niño conditions.” Moreover: in previous work, we also found that temporal clustering of atmospheric rivers in longitudinally-oriented “families” is more than twice as likely during El Niño conditions.
What does all of this mean, in practice? Well, I would agree that it’s true (as many have already reflected) that even a strong El Niño does not guarantee any particular outcome in terms of California precipitation. But it would also be a huge mistake to think that El Niño doesn’t tell us anything about what might happen! In fact, a very strong El Niño event might well be the single most important predictor of substantially increased odds of unusually wet conditions, and increased likelihood of individual heavy precipitation events, in any given winter in California–and perhaps also an early warning indicator of increased risk of large-scale flood events.
To be crystal clear: it is impossible to know, this far in advance, whether California will see a major flood event during winter 2026-2027. Neither I, nor anyone, can make that kind of prediction with confidence in June. But many, if not most, real-world decisions are made on the basis of “tilts in the odds” rather than absolute certainties, so I think it’s entirely reasonable to be having this conversation today. In fact, if I had to come up with a list of hypothetical atmospheric conditions that would be conducive to a very wet California winter with notably increased flood risk, they would look strikingly similar to what the seasonal ensembles are currently depicting for winter 2026-2027.
Could there be some good news in all of this? Yes! The Colorado River basin is currently experiencing an exceptionally severe multi-decadal drought, which has worsened again this year due to record-breaking low snowpack. Prospects of an average-to-above average monsoon, coupled with the potential for above-average winter precipitation to follow, offer some hope of partial amelioration later this year. That may not prevent some difficult decisions from being made regarding water allocation in the meantime, this summer, since a good outcome is not guaranteed. But a solid water year would be greatly appreciated in the Colorado Basin and broader Southwest–and there are indeed better odds that it’ll happen this year than in most.
It’s worth noting that El Niño events, in general, can also reduce winter precipitation in the Pacific Northwest via the same southward shift in the Pacific storm track that brings more precipitation to California. That would be unwelcomed, especially given the expectation of a hot summer there following pre-existing drought. But this relationship is not as clear-cut as the California wet boost during a strong event–so I’m reserving judgement for the moment until we get closer to next winter.
One final precipitation-related reflection: Some folks will point to the last very strong El Niño event in 2015-2016 as evidence that “El Niño doesn’t matter for California precipitation.” Now, it is true that winter 2015-2016 was not an especially wet year in California, despite the occurrence of a very strong El Niño event and associated predictions that the odds of a wet winter were much higher than usual. That part is not in dispute! But as I’ve repeatedly emphasized, over the past decade, 2015-2016 represents but a single event: A sample size of one. The other two comparably large events in the last ~40 years, in 1982-1983 and 1997-1998, were indeed very wet in California. And while those two years are, in themselves, still only a sample size of two, we’ve got abundant evidence from both meteorological theory and process-based model experiments to bolster the evidence base. When it comes to El Niño and California precipitation, strength matters–and I’m making the same prediction for this winter as I did in 2015-2016 (just as I said I would, the better part of a decade ago, when comparable conditions arose in the future).
There is one additional California-specific Super El Niño-related-consideration, and that’s the potential for elevated sea levels and coastal flooding. Major El Niño events can raise local sea level by around 6-10 inches in California during the winter rainy and stormy season through a combination of northward-propagating coastally-trapped Kelvin waves and thermal expansion of seawater. While that might not seem like a lot, this (temporary) increase will occur atop an additional (permanent) 6-10 inches of sea level rise that has accumulated due to global warming over the past century. Moreover: because a strong El Niño event also increases the likelihood of nearby low pressure systems, which can cause additional short-duration sea level increases via storm surge and wave action, it is possible that ocean (and bay/estuary) levels could be as much as 2-3 feet higher than usual during major winter storms this year, and even higher than that should a storm coincide with the usual King Tides. Thus, as has occurred during previous very strong El Niño events historically, significant coastal flooding is possible later this year–and I would not be surprised to see some locations break all-time historical coastal water height records given the additional contribution from global warming and ongoing local land subsidence.
What are the broader global implications of a potential “super” El Niño in 2026?
In general, the stronger the El Niño event, the higher confidence there is that it exerts a profound global influence consistent with its “canonical” hydroclimate pattern shifts (i.e., global teleconnections). For the very strongest El Niño events–including, potentially, this year’s–both the confidence in these impacts as well as their expected intensity increase. When the profound (but temporary) influence of a potentially very strong El Niño event combines with the even more profound (and sustained) influence of over a century of global warming, there will likely be a few consequences of particular note:
- Widespread manifestation of “classic” El Niño weather pattern disruption from regional to global scales, including suppression of hurricane season in the tropical Atlantic, increased drought risk across the Maritime Continent, Amazonia, and possibly southeastern Africa and the Caribbean, and increased precipitation and possible flood risk in the Southwestern and Southern United States as well as small pockets of southeast Asia and southeast South America.
- Record-breaking global temperatures, especially later in 2026 and into 2027 as El Niño fades. This will likely first manifest as sustained anomalous tropical/subtropical warmth this summer and autumn, then progress to more amplified heatwaves in the mid-latitudes beginning in 2027, and represents the “stair step” upward trajectory that we’ve seen repeatedly during significant El Niño events amid rapid human-caused global warming.
- A probable increase in extreme hydroclimate events, globally, in 2026-2027 even relative to the already-elevated recent baseline. This is a direct consequence of #2 above, since the “expanding atmospheric sponge” effect (via the air’s increased capacity to evaporate and precipitate water as temperatures rise) acts on both the human-caused long-term warming as well as the natural and temporary warming from El Niño. Together, the effect will likely be striking.
Ultimately, the upcoming El Niño event–which has a high likelihood of becoming very strong or even historic in magnitude–will likely lead to widespread and significant global impacts. It is possible, even probable, that at least some of these effects will be unprecedented in the modern era given the combined effects of a high-end El Niño event plus over a century of accumulated global warming.
One silver lining is that this year’s global climate outlook–even 3-6+ months in advance–features an unusually strong predictive signal (between a strong El Niño plus long-term warming, perhaps the strongest I’ve ever seen). This means that we have, both regionally and globally, significant advance warning that the next 6-12+ months have an elevated likelihood of featuring high-consequences hydroclimate and heat extremes (the precise “flavors” of which will vary by region). I, along with many of my colleagues, am actively working to help integrate these predictions into planning and preparedness actions that will hopefully improve outcomes. If the current prediction surrounding a very strong El Niño event in 2026 ultimately comes to pass, it will become both a widely disruptive global event as well as an incredible scientific predictive success–a duality that has become increasingly common in our warming world.
How to stay up to date on the major El Niño event as it unfolds
I’ll likely have another major Weather West update on El Niño in the autumn once the peak magnitude becomes clearer and winter implications loom large. In the meantime, I’ll be following as always across social media channels (take your pick), and will also have additional dedicated El Niño-focused interactive livestreams on YouTube over the next few months. In the meantime, you can also check out the recording of my May 2026 live discussion on the same topic, plus shorter clips from that session. Either way, if you are a newcomer to (or longtime reader of) the Weather West blog, I’d strongly encourage you to subscribe to the Weather West YouTube channel (and, if you’re interested in knowing when I’ll be going live, turn those notifications on!).
Discover more from Weather West
Subscribe to get the latest posts sent to your email.