Note: This special Weather West article focuses on a new peer-reviewed scientific review article, recently published in the journal Nature Reviews: Earth and Environment, that I led with a fantastic team of collaborators from NSF NCAR, ETH Zurich, UC Merced, Desert Research Institute, Stanford University, WSU Vancouver, UMass Lowell, and UT Austin over the past several years.
What is “hydroclimate volatility?”
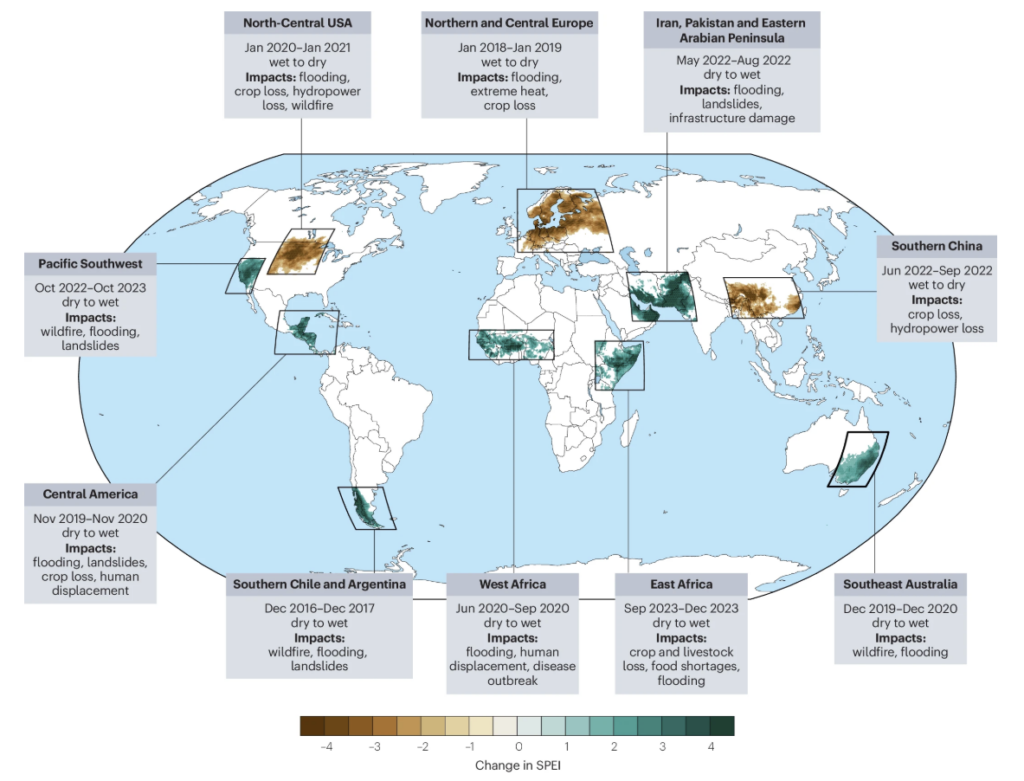
(Reproduced from Figure 1 in Swain et al. 2025)
Hydroclimate volatility broadly refers to unusually rapid and/or high magnitude swings between unusually wet and dry conditions (or vice versa) relative to what is typical for a given location and season. Such rapid transitions can often generate hazards that are distinct from their constituent wet and dry extremes (e.g., floods and droughts), meaning that hydroclimate volatility can yield overall societal and ecological risks that are “greater than the sum of their parts.”
The exact terminology used to describe such volatility in the existing scientific literature is wide ranging; across the more than 200 studies we reviewed for this paper, we encountered sometimes colorful language including: hydroclimatic intensity (or variability), hydrological intensity, event-to-event variations, transitions between wet and dry periods, drought–pluvial seesaws, drought and pluvial transitions, consecutive dry and wet extremes, compound whiplash events, accelerated swings between dry and wet spells, precipitation whiplash, precipitation variability, and weather or climate whiplash. The common thread spanning each of these are sudden and/or high-magnitude shifts between wet and dry hydrologic states–and that set the stage for us to dig deeper regarding how such events may be changing as a result of the Earth’s warming climate.
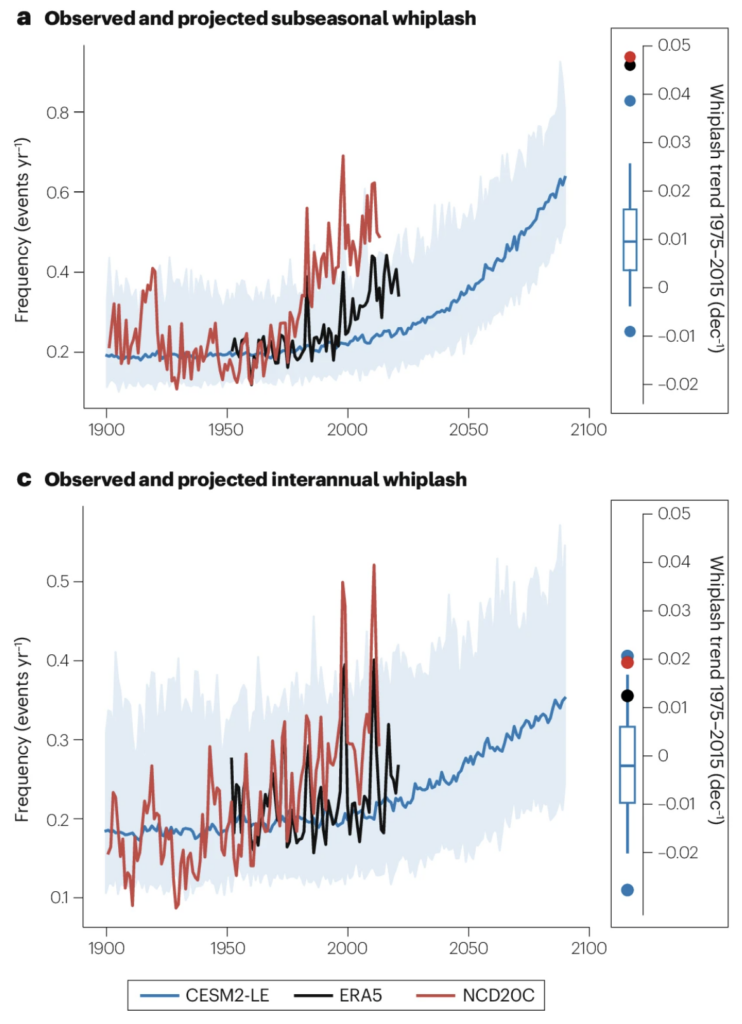
In addition to performing an extensive literature review, we also conducted our own (brief) analysis of observed and projected trends in what we term “hydroclimate whiplash”–a quantity that we define to encompass unusually rapid transitions between extremely wet and extremely dry conditions as defined by the Standardized Precipitation-Evaporation Index (SPEI; see paper for details). In the sections below. I discuss both our overall assessment of the state of the science surrounding hydroclimate whiplash, as well as our own specific findings using this metric.
Global hydroclimate whiplash has already increased due to global warming
As part of this review, we briefly assess historical trends in hydroclimate whiplash. This is, decidedly, not a simple task due to considerable uncertainties that exist within most globally-spanning datasets that include the needed information regarding precipitation and temperature (and also because historical trends in this kind of quantity are “noisy,” especially at regional scales, due to the influence of natural climate variability). Using two separate datasets, however, we find quite substantial increases (~30-65% for subseasonal whiplash, and ~10-30% for interannual whiplash) in observed whiplash at global scales through 2015, with the last few years experiencing continued increases and some of the highest aggregated whiplash frequency on record. Due to dataset uncertainties, it’s harder to pinpoint the magnitude of whiplash changes in specific regions–though many of the studies we reviewed found evidence for historical increases in specific regions using more locally-targeted metrics and datasets. (See below for some more detailed reflection on observed trends in California specifically.)
Generally speaking, this is a larger increase than what a flagship climate model large ensemble (CESM2-LE) suggests would have occurred at our present (~2023) level of warming. Will this apparently faster-than-predicted (at least in one leading climate model ensemble) increase in global hydroclimate whiplash continue? At this time, we simply don’t know; in the paper, we offer some possible explanations (including the possibility that recent trends in the El Niño Southern Oscillation (ENSO), which have unfolded somewhat differently than had been projected, might be involved). But we also know that coarse-resolution global climate models, like the ones used in our analysis and in most of the ~200 studies we reviewed, tend to underestimate increases in the very most extreme precipitation events as well as kinds of land-atmosphere-biosphere feedbacks that can cause some heat and drought events to become partially self-amplifying–so it is at least plausible that our estimates of future whiplash increases are conservative.
(Adapted from Figure 2 in Swain et al. 2025)
What is the primary culprit? Blame the “Expanding Atmospheric Sponge.”
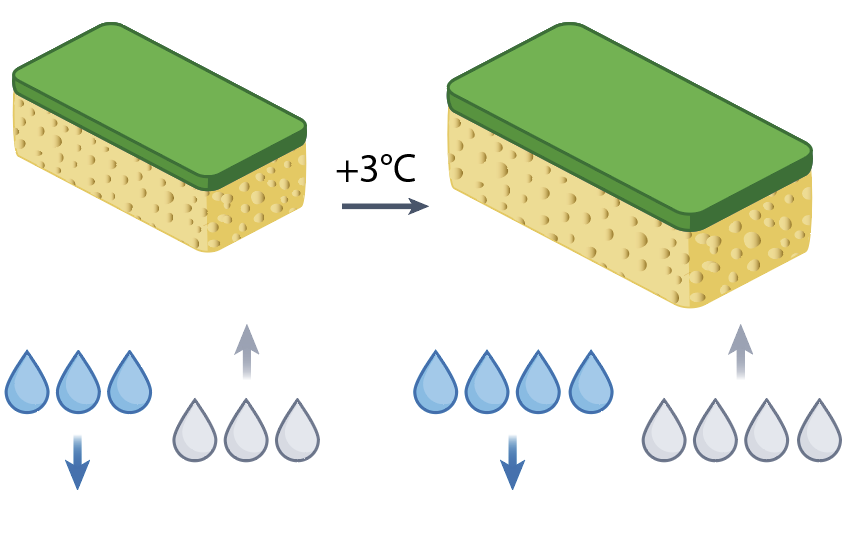
(Reproduced from figure in Box 2 in Swain et al. 2025)
It has long been known–since the mid-1800s, in fact, long before we had computationally-based climate models–that the rate of evaporation (and condensation) over a liquid surface increases exponentially as temperatures rise linearly. In the Earth system, this becomes an hugely important practical consideration in an era of global warming, since we live on a planet that is ~71% water-covered, and because water vapor plays a critical role in all aspects of the Earth’s climate system. As a result of what is today known as the Clausius–Clapeyron relation (C-C relation), the saturation vapor pressure of air with respect to water (i.e., the maximum “water vapor holding” capacity of the atmosphere) increases by about 7% per °C (4% per °F) of temperature increase.
This increase in the maximum amount of water vapor that can be in the air at any given moment would suggest that the total amount of water vapor in the Earth’s atmosphere should increase with global warming–and, indeed, it has. This increase in the maximum amount of water vapor that can be present in air is the main reason why we have already experienced an increase heavy precipitation events globally, and in most sub-regions–and that increase is expected to become even more widespread (nearly universal) over global land areas with further warming.
But while overall atmospheric water vapor does increase with warming, that does not mean that it increases everywhere and at all times. In fact, at times and places where the atmosphere is not saturated (i.e., when there are not clouds and/or precipitation present), this very same thermodynamic mechanism also explains why the atmosphere has an increased propensity to evaporate water from bodies and water and the land surface. In practical terms, this means that the gap between the “floor” and the “ceiling” (i.e., the amount of water vapor that air actually contains, versus how much it could contain) itself rises exponentially in a warming atmosphere, leading to rapid increases in what is known as the “vapor pressure deficit” as well as driving widespread and large increases in evaporative demand (i.e., the “thirstiness” of the air itself).
In so doing, the C-C relation offers a rather profound explanatory mechanism for around 70-80% of the hydrological cycle intensification we see globally, both in observations and in future projects. Increasingly extreme rain events, as well as increasingly severe (potential) evaporation events, are therefore two sides of the very same thermodynamic coin on a warming Earth, and can drive increases in both potential flood severity as well as potential drought severity (and, therefore, also things like wildfire severity–as discussed further below).
In this paper, we introduce the analogy of the “Expanding Atmospheric Sponge” (EAS) to describe this phenomena in a (hopefully!) intuitive way. Imagine, as in the image above, two ordinary kitchen sponges, one notably larger than the other. Not only can a larger sponge yield more water if saturated (and wrung out), but its absorptive capacity increases even if there’s no water available to absorb. Critically, this illustrates how the (figurative) EAS can generate not only more intense precipitation events, but also has the ability to extract more moisture out of the landscape–ultimately leading to increased vegetation aridity, and hence flammability, even in places where average precipitation does not increase. In fact, this can occur (at least episodically) even in places that see mean precipitation increases!
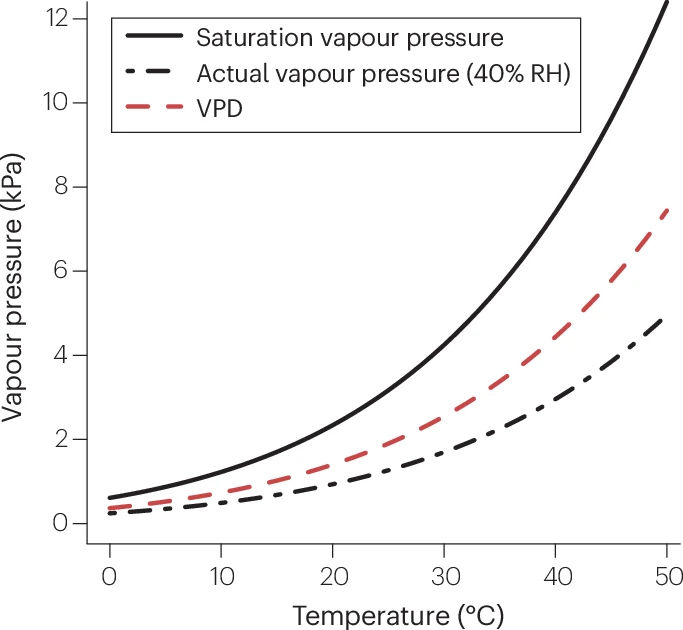
(Reproduced from Figure 4 in Swain et al. 2025)
As we discuss at greater length in the paper, observed and projected changes cannot be explained solely through the lens of the EAS Effect. At global scales, the EAS does indeed dominate, but at regional scales, changes in atmospheric circulation–horizontal and vertical winds that dictate storm tracks and local weather patterns–become important as well. In some cases, atmospheric circulation changes amplify the EAS and lead to even greater regional intensification of the hydrologic cycle; in others, they offset the EAS, leading to smaller local changes than might otherwise be expected from thermodynamics alone.
One challenge, however, is that regional atmospheric circulation changes are generally much more poorly understood, and simulated, than the EAS–and so it’s not always clear that historical trends in circulation are actually caused by long-term greenhouse gas-caused warming (and, therefore, whether they will continue in the coming decades). For this reason, and also because the EAS is by far the single most powerful explanatory factor at global scales regarding why increases in projected hydroclimate whiplash are so widespread, we focus on this mechanism in this review (an approach that is supported by the existing research we also review); in the case of specific regions, however, those (still uncertain) changes in atmospheric circulation are likely to be consequential. In California, for instance, they will likely affect the “flavor” of increased hydroclimate whiplash we ultimately experience: while increasing whiplash appears more or less inevitable in this part of the world, whether it comes in a more wet or dry “flavored” variety will likely depend, in large part, how the jet stream shifts seasonally over the North Pacific.
Further large increases in global hydroclimate whiplash expected
In our own brief analysis, we find that hydroclimate whiplash will likely continue to increase with additional global warming, and likely emerge more strongly and unambiguously in more regions . At a level of 3°C (5.4°F) of global warming–a relatively high but still plausible warming level for late this century given the range of scientific and other uncertainties on a “current policy with modest additional climate action” trajectory (median estimates are closer to 2.7°C (4.9°F) )–we report a projected doubling (>100% increase) in the global frequency of subseasonal whiplash events over global land areas as well as a ~50% increase in interannual whiplash. These projected increases are strongest over global land areas (though extend across most oceans, with smaller magnitude)–likely due to the amplifying effect of faster-warming continents.
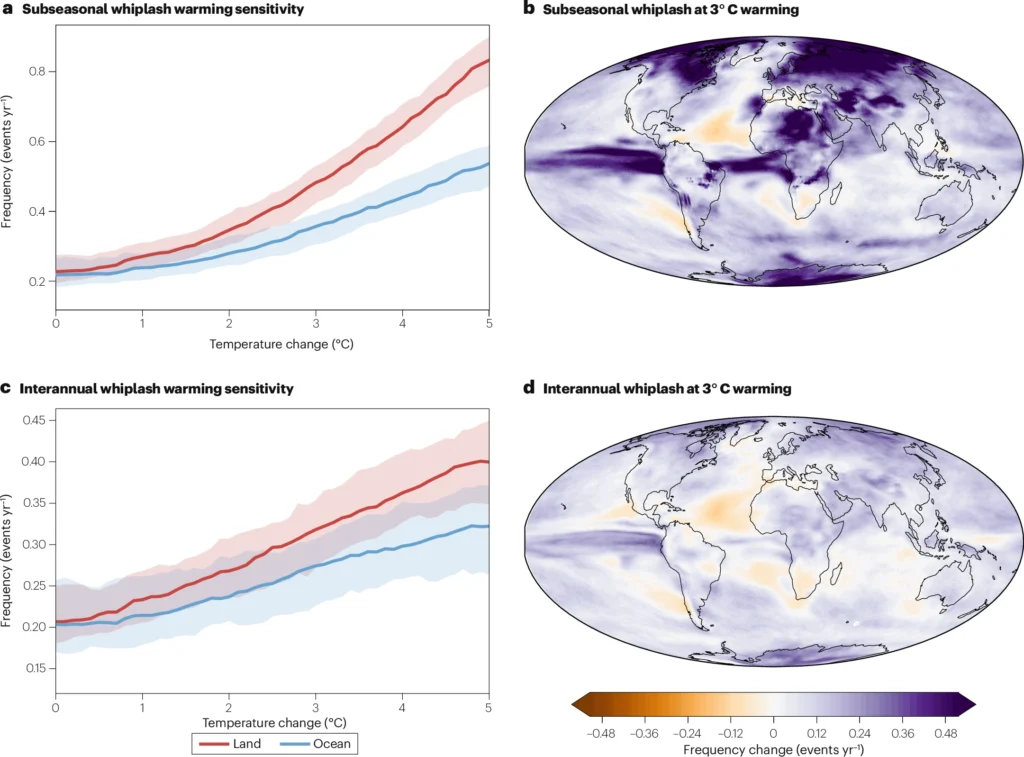
(Reproduced from Figure 3 in Swain et al. 2025)
Notably, in the climate model simulations we consider for this review, the pace of hydroclimate whiplash increases accelerates between 1°C and 3°C of warming–and today, the Earth has warmed (on a multi-year average basis) around 1.4°C (yes, this is true even though 2024 and 2025 were individually at or above 1.5°C in most datasets). That means that we, right here and right now, might well be living through the projected acceleration in the frequency of global hydroclimate whiplash.
Some thoughts about California specifically: in this review piece, we chose a whiplash metric that would broadly applicable across the entire Earth. That means it may not be the optimal quantity to capture California’s particular “flavor” of hydroclimate variability changes. We still find increases in California hydroclimate whiplash with rising global temperatures, but the Golden State is decidedly not a global hotspot using this particular generalized metric compared to other regions that are projected to experience much larger increases. However, other work (including my own) has examined changes in California’s hydroclimate variability using more regionally-tailored metrics and found robust projected increases here too–including increases in precipitation whiplash (especially across southern California), the sharpness of California’s seasonal precipitation cycle (with drier autumn and spring shoulder seasons but perhaps wetter winters), and overall hydroclimate intensity (integrating the length of dry spells, the intensity of wet spells, and the magnitude of evaporative demand). Indeed, as illustrated below, there is evidence that California’s overall hydroclimate variability has already increased substantially over the past century; in that sense, recent experience with both extreme dry and extreme wet events (and transitions between them) is indeed likely representative of future trends (even if the underlying data regarding observed changes in wet extremes in this part of the world remain noisy).
In a warming world, a growing need to co-manage drought, flood, and “whiplash transition” risks
Amid increasing hydroclimate whiplash, there is a real risk of “mal-adaptation” to a warming climate if the potential hazards associated with wet and dry extremes are only considered and planned for in isolation. In California, for instance, there has long been focus on how climate change will increase the severity of droughts and pose new challenges for water management amid increasing scarcity. In itself, that’s not a bad thing–droughts have already become more intense in California due to warming, so increased resilience to deeper and more intense periods of water scarcity is likely a smart and worthwhile investment. However, historically less recognized has been California’s already large and growing vulnerability to widespread and severe flood events that have the potential to dwarf those in the 20th century–a risk that is also rising thanks to the “expanding atmospheric sponge.”
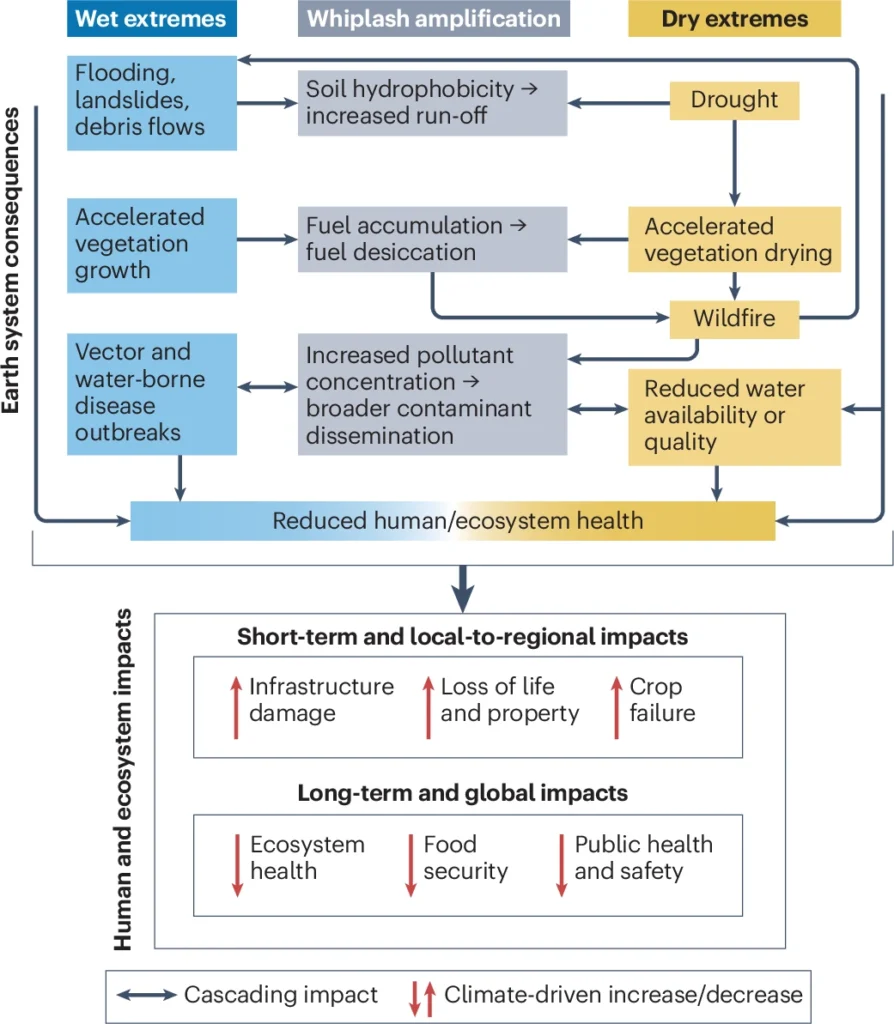
(Reproduced from Figure 5 in Swain et al. 2025)
Over the past few years (and perhaps due to the recent experience with some major but not catastrophic regional flood events), recognition of the rising flood hazard in California has begun to receive more attention from a policy and planning perspective (and that’s a good thing!). Yet efforts to improve California’s resilience to extreme flood events still lags behind its historical successes in preparing for severe and long-duration droughts. In addition, some of the greatest water overabundance or scarcity-related hazards California faces are actually related to the suddenness (or magnitude) of the transition between wet and dry states. Consider, for example, the increased risk of debris flows in steep terrain following severe droughts or intense wildfires when torrential rain falls on parched or burned soils; even wildfire risk itself can be accentuated by swings from very wet to very dry conditions (as discussed further below).
Ultimately, my hope is that the paradigm of increasing hydroclimate volatility–whether as measured by “whiplash” or some other metric–can help shift disaster emergency response & planning, as well as climate adaptation policies, toward those which are commensurate with the full range of changes we’re already seeing at both ends of the hydroclimate spectrum (as well as the subsequent transition risks). That includes, in California and beyond, the co-management of drought and flood using innovative approaches like flood-managed aquifer recharge and forecast-informed reservoir operations.
Southern California’s January 2025 wildfire disaster has links to ongoing wet-to-dry whiplash episode
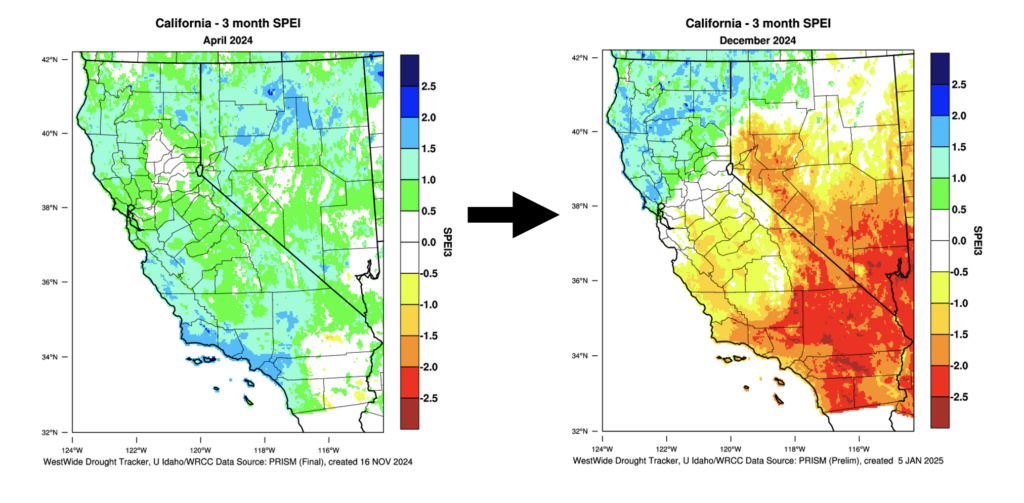
(Source: WRCC) via John Abatzoglou.
Is there a link between climate change and the broadly increasing risk/severity of wildfire in California? Yes; that much is clear at this point. Is climate change the only factor at play? No, of course not! Are there additional caveats and context surrounding the devastating southern California wildfire disasters in January 2025? Absolutely. So how does the fuller picture look, and how does it relate to hydroclimate whiplash?
As a rule of thumb: there is rarely, if ever, a singular cause of complex disasters. With respect to wildfire, population expansion into high risk areas (aka the “Expanding Bullseye Effect,” which describes the growing “target” expanding cities represent in a natural hazard context), historical land management (including historical fire exclusion in relevant ecosystems, as well as fuel management programs (or lack thereof) in more urbanized settings), and long-term climate shifts all matter to contextually varying degrees. These decidedly important “other than climate” factors will undoubtedly be the subject of much discussion in the coming weeks and months, but here I’m focusing on what we do know about the climate connection. (That is, despite some recent claims to the contrary, how the scientific method is supposed to work: researchers focus on specific, contextually-informed, and scientifically tractable scientific questions that can actually be addressed using the tools, methods, and data available. In practice, this means that each individual analysis cannot comprehensively assess the totality of all possible contributors to complex events–no matter how much we might wish that were possible.)
One of the primary links between climate change and wildfire–both in California specifically and more broadly globally–is through vegetation moisture, and therefore its flammability (which includes propensity to ignition, combustion intensity, rates of fire spread, and ease with which fires can “self intensify” by generating their own localized weather conditions). With climate change, we see (of course) warming temperatures but also widespread increases in atmospheric “thirstiness” (i.e., evaporative demand/vapor pressure deficit) as a result (via the “expanding atmospheric sponge”). In the absence of compensating precipitation increases, a thirstier atmosphere means (potentially) drier, more flammable vegetation.
Many distinct ecological and fire regimes exist within California, and fire season is generally much longer in the southern vs. northern parts of the state (and can/does occasionally extend into winter in coastal SoCal). Because of this, the response of ecosystems and fire regimes to climate change can vary considerably from place to place. In fact, in coastal southern California–where grass and brush (including chaparral) are predominant vegetation types–there is actually a historical relationship between wetter winters and increased fire activity in following fire season. Why is this? Ecosystems in arid and semi-arid regions tend to be effectively “biomass-limited” when it comes to wildfire–in other words, the abundance of grass and brush varies according to moisture availability year to year. In wetter years, there is more growth of rapidly-responding herbaceous plants. Hence, there is literally more fuel for potential wildfires following wetter periods in grassland/shrubland-dominated ecosystems like much of Southern California.
In a world with increasing hydroclimate volatility, episodes of “wet-to-dry” whiplash will increase in frequency and magnitude (likely including California). We already know that a warming atmosphere yields a longer, more intense fire season in California, but in this way, it may also (literally) be have the potential to add additional fuel for the fires to come (and then, increasingly, drying it to and past critically dry levels). Thus, in a way that may now be acutely tangible to southern Californians after what has transpired in early 2025, the “worst climate for wildfire” may in fact not be one that becomes steadily hotter and drier, but instead one that increasingly lurches back and forth between episodic wet and dry extremes, yielding increasingly large swings between rapid fuel accumulation and subsequent drying (especially in grassland, shrubland, and woodland environments).
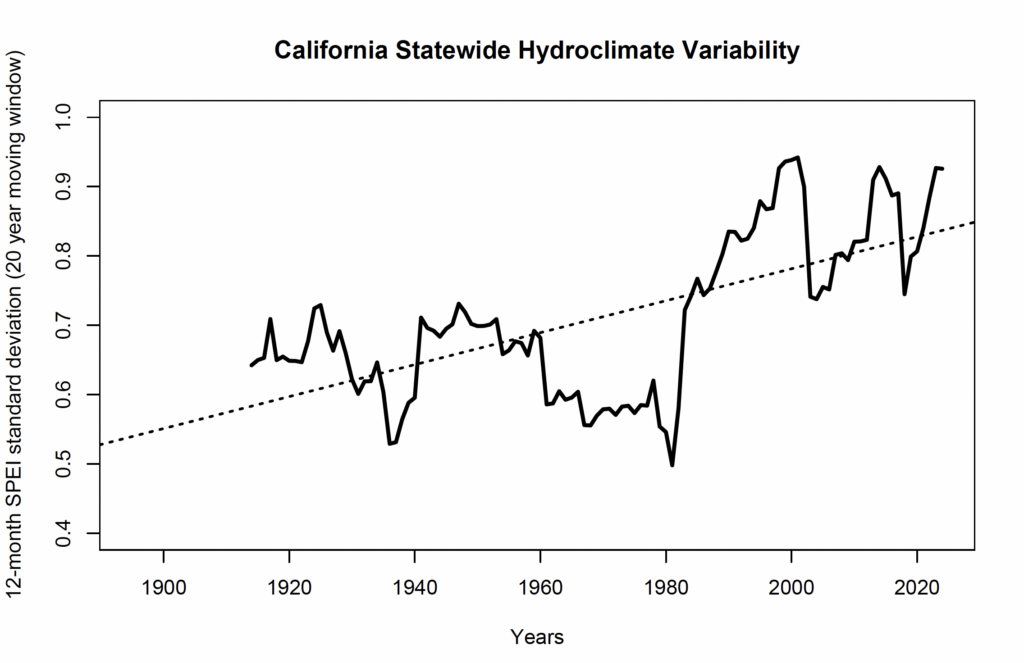
(Data via WRCC West Wide Drought Tracker; plot by Daniel Swain)
In the final months of 2024 and continuing into early 2025, Southern California experienced an exceptional episode of wet-to-dry hydroclimate whiplash. Very wet conditions in winters of 2023 and 2024 gave way to a record-dry start to 2025 wet season (with periods of record warmth and evaporative demand sandwiched in between). A very strong and dry downslope windstorm in early January was the proximal catalyst for the unprecedented wildfire disasters that subsequently unfolded, but the far more anomalous whiplash event that preceded it (including the failure of seasonal rains to arrive as of this mid-January writing) is what truly set the stage. Thus, continued warming, plus wider swings between extreme wet and extreme dry, are likely to increasingly interact with California’s narrowing rainy season to produce more frequent overlap between critically dry vegetation conditions and strong, dry “offshore wind” season–particularly across coastal Southern California.
How is this article different from typical Weather West blog posts?
This special Weather West article focuses on a peer-reviewed scientific review paper that my colleagues and I recently published in the journal Nature Reviews Earth & Environment. This means that the content of this piece is based upon both our synthesis of existing findings from around 200 scientific investigations by independent teams of researchers, as well as additional new analyses presented in the review paper itself. This is in contrast with more typical Weather West posts, which are primarily based upon my own informal thoughts and analysis. I would like to thank my co-authors in this work—Andy Prein, John Abatzoglou, Christine Albano, Manuela Brunner, Noah Diffenbaugh, Deepti Singh, Chris Skinner, and Danielle Touma—for their sustained efforts in bringing this project to completion over multiple years! Support for my own contribution to this research was provided through a partnership between UCLA’s Institute of the Environment and Sustainability and The Nature Conservancy of California, and more recently through my new role with UC Agriculture and Natural Resources.
A full version of this paper will be freely available to all readers for 14 days following initial publication on January 9, 2025 (special thanks to the editor for this!), and to all with journal subscription access thereafter, here (Swain et al. 2025). A “read-only” version of the full paper will also be available to all, regardless of subscription access, via this ReadCube link. Additionally, and as always, you can reach out to me directly to obtain a copy for research and/or educational purposes.
Discover more from Weather West
Subscribe to get the latest posts sent to your email.