Special update: The Extraordinary California Drought of 2013-2014: Character, Context, and the Role of Climate Change
A note from the author
This special update is a little different from what I typically post on the California Weather Blog. In the paragraphs below, I discuss results from and context for a study that my colleagues and I recently published in a special issue of the Bulletin of the American Meteorological Society (Swain et al. 2014).
Unlike the majority of content on this blog, this report has undergone scientific peer review—an important distinction to make in the science blogosphere—and claims made on the basis of our peer-reviewed findings are marked with an asterisk (*) throughout this post. A reference list is provided at the end of the post, and the full BAMS report is available here. I would like to thank my co-authors—Michael Tsiang, Matz Haugen, Deepti Singh, Allison Charland, Bala Rajaratnam, and Noah Diffenbaugh—all of whom played critical roles in bringing this paper together.
The really short version
In 2013 and 2014, a vast region of persistently high atmospheric pressure over the northeastern Pacific Ocean–known as the “Ridiculously Resilient Ridge”–prevented typical winter storms from reaching California, bringing record-low precipitation and record-high temperatures. These extremely dry and warm conditions have culminated in California’s worst drought in living memory, and likely the worst in over 100 years. Human-caused climate change has increased the likelihood of extremely high atmospheric pressure over the North Pacific Ocean, which suggests an increased risk of atmospheric patterns conducive to drought in California.
What are the effects of the ongoing extreme drought in California?
The impacts of the drought are wide-ranging, and continue to intensify with each passing month. Curtailment of state and federal water project deliveries for agricultural irrigation have already resulted multi-billion dollar losses as thousands of acres of farmland are fallowed. Small communities in some regions have started to run out of water entirely, and increasingly stringent urban conservation measures have been enacted over the summer as reservoir storage drops to critically low levels. Thousands of new water wells have been constructed on an emergency basis over the past year, and skyrocketing rates of groundwater pumping have led to rapid land subsidence in the San Joaquin Valley. Not to be outdone, snowpack in the Sierra Nevada Mountains was almost nonexistent for much of 2013-2014, and at least one of California’s major rivers is no longer reaching the Pacific Ocean.
The severity of California’s drought is so great that it is starting to change the physical geography of the state. The Sierra Nevada’s mountain peaks have risen measurably since 2012 as the Earth’s crust rebounds from the net loss of 63 trillion gallons of water—an amount equivalent to the entire annual ice melt of the Greenland Ice Sheet. Intense, destructive wildfires are burning throughout the state, and while September and October are the peak of the typical fire season in California, the number of fires exhibiting extreme behavior and “dangerous” rates of spread has been far higher than usual due to the ubiquity of tinder-dry, drought-cured brush and trees. Conditions have been so warm and dry that at least one glacial outburst flood has occurred on the slopes of Mt. Shasta as winter ice accumulation decreases and summer melt accelerates. The overall visibility and severity of these impacts have brought the drought to the forefront of California politics: landmark legislation regarding the regulation of groundwater recently was recently passed by the state legislature and has now been signed by the governor, and a “water bond” will feature prominently as Proposition 1 on the California ballot this November.
Just how severe is the current drought relative to others in California’s past?
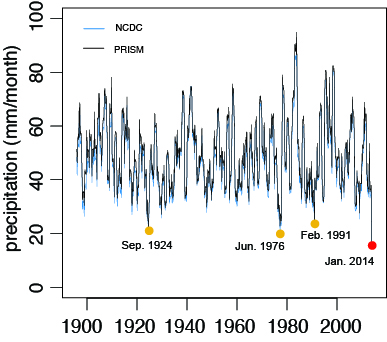
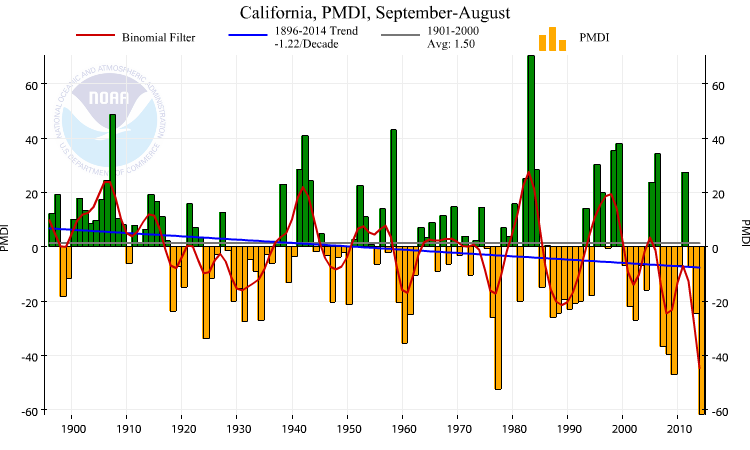
California is currently experiencing its third consecutive year of unusually dry conditions, but the intensity of California’s long-term drought has increased dramatically over the past 18 months. 2013 was the driest calendar year in at least 119 years of record keeping—but even more impressively, the current drought now encompasses the driest consecutive 12-month period since at least 1895.* This means that the maximum 12-month magnitude of the precipitation deficits in California during the current drought have exceeded those during all previous droughts in living memory—including both the 1976-1977 and 1987-1992 events.* As of September 2014, 3-year precipitation deficits now exceed average annual precipitation across most of California, and most these anomalies stem from the exceptional dryness during 2013 and early 2014. For many practical purposes, 2013 was a “year without rain” in California—an extraordinary occurrence in a region with a traditionally very well defined winter rainy season.
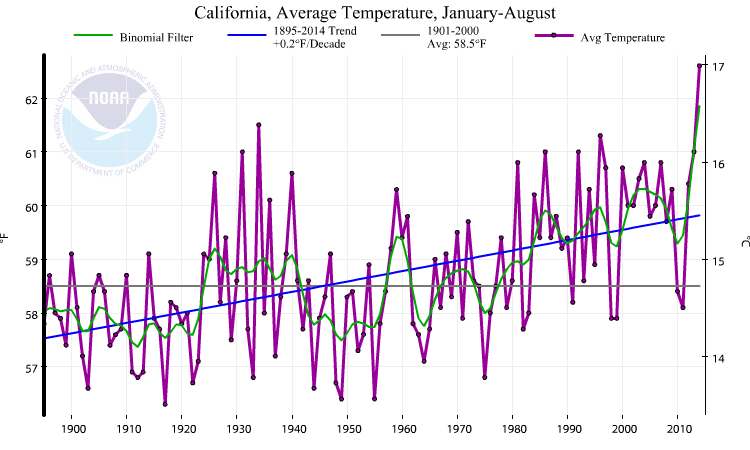
In addition to extremely low precipitation, California has also been experiencing exceptional warmth over much of the past year. 2014 is currently California’s record warmest year to date by a wide margin—meaning that it has been warmer during the current drought than during any previous drought since at least the 1800s. Warm temperatures increase the rate of evaporation from parched soils and critically dry rivers, lakes, and streams—exacerbating the impacts of existing precipitation deficits. In fact, primary metrics of overall drought severity—including the widely-used Palmer Drought Severity Index (PDSI)—have now reached their lowest levels since at least the 1800s. All of this evidence points consistently toward an increasingly inescapable reality: that the 2013-2014 drought in California is the worst in living memory, and likely in well over a century.
What’s causing these incredibly warm and dry conditions in California?
The atmospheric pattern over much of North America has been exhibiting a remarkable degree of persistence over the past 12-18 months. This very unusual atmospheric configuration—in which the large-scale atmospheric wave pattern appears to be largely “stuck” in place—has been characterized by a seemingly ever-present West Coast ridge and a similarly stubborn trough over central and eastern United States (commonly referred to in media coverage as the “Polar Vortex,” though this terminology is arguably problematic). This so-called “North American dipole” (highlighted by Wang et al., 2014) has resulted in persistent warm/dry anomalies along the West Coast and persistent cool/wet anomalies over the Midwest and Eastern Seaboard.
Because of the extraordinary persistence and strength of the western half of this wave pattern and its conspicuous impacts in California, I started referring to this anomaly as the “Ridiculously Resilient Ridge” (or “Triple R”) in December 2013. Since that time, the Triple R has waxed and waned—and for a brief period during February and March 2014, faded away almost entirely. But the anomalous Ridge returned during the spring months, and has continued to be a notable feature of the large-scale pattern through summer 2014.
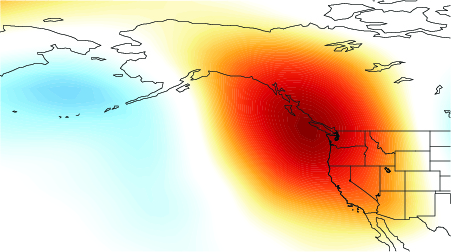
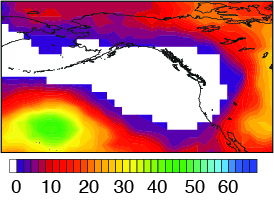
It’s important to note that the Triple R is not a feature that has necessarily been present every single day for the entire duration of the California drought. The “resilience” of the Triple R is key to its significance: despite occasional, transient disruptions of the persistent high pressure on daily to weekly timescales, the much-maligned Triple R has been in place more often than not since early January 2013. Averaged over multiple months (and now up to a year or more), the Ridge pops out as a strikingly prominent feature in map plots of the large-scale atmosphere.* In fact, the region of historically unprecedented (since at least 1948) annual-scale geopotential height anomalies associated with the Triple R extend over a truly vast geographic region—from central California westward across the entire North Pacific to the Kamchatka Peninsula in the Russian Far East.* Extremely high geopotential heights (a vertically aggregated measure of atmospheric temperature) over the northeastern Pacific Ocean are historically linked to very low precipitation in California.* This is consistent with previous work by other researchers, and highlights the fact that such extreme values are usually linked to a northward shift in the storm track, which directs storms away from California.
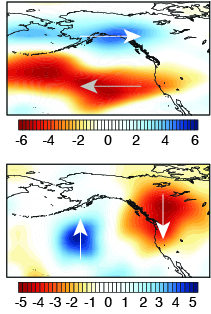
Over these many months—and especially during the second half of the 2012-2013 rainy season during January 2013-May 2013 and the first half of the 2013-2014 rainy season during October 2013-January 2014—the Triple R induced persistent shifts in the large-scale wind patterns near and west of California.* During California’s rainy season, which typically runs from late October through early May, winter storms approach California from the west and northwest, bringing Pacific moisture to the region in the form of periodic rainfall and mountain snowfall. The latitude of the “storm track” along the West Coast—largely defined by the position of the jet stream—varies from day-to-day, month-to-month, and even year-to-year. During the 2013-2014 California drought, however, the Triple R pushed the jet stream well to the north of California (and, for much of that period, even north of Oregon and Washington).* This northward deflection of the storm track prevented precipitation-bearing low pressure systems from reaching California for large portions of two consecutive rainy seasons, ultimately resulting in the lowest 12-month precipitation on record in California.*
In addition to causing extremely low precipitation in California, the Triple R is also largely responsible for California’s record warmth over the past 9 months. During the cool season, the Ridge brought long stretches of cloudless days, which caused daytime temperatures during winter to be well above average (and, at the same time, the position of the ridge also prevented major cold air outbreaks from occurring after December 2013). During the warm season, the Ridge has helped to shut down the typical northwesterly prevailing winds along the coast (and thus the upwelling) that are responsible for northern and central California’s legendarily cold ocean surface temperatures. This combination of endless clear skies and far warmer than usual near-shore ocean temperatures have allowed California’s air temperatures thus far in 2014 to be the warmest on record since at least 1895–and by a considerable margin.
Why has the North Pacific/West Coast ridge been so “ridiculously resilient?” Has climate change increased the risk of events like the 2013-2014 California drought? Click here to read more on the next page!