Extreme atmospheric rivers: what will California’s strongest storms look like in a warming climate?
Note: This special Weather West article focuses on new peer-reviewed scientific research, led by Xingying Huang, that my colleagues and I recently published in Science Advances.
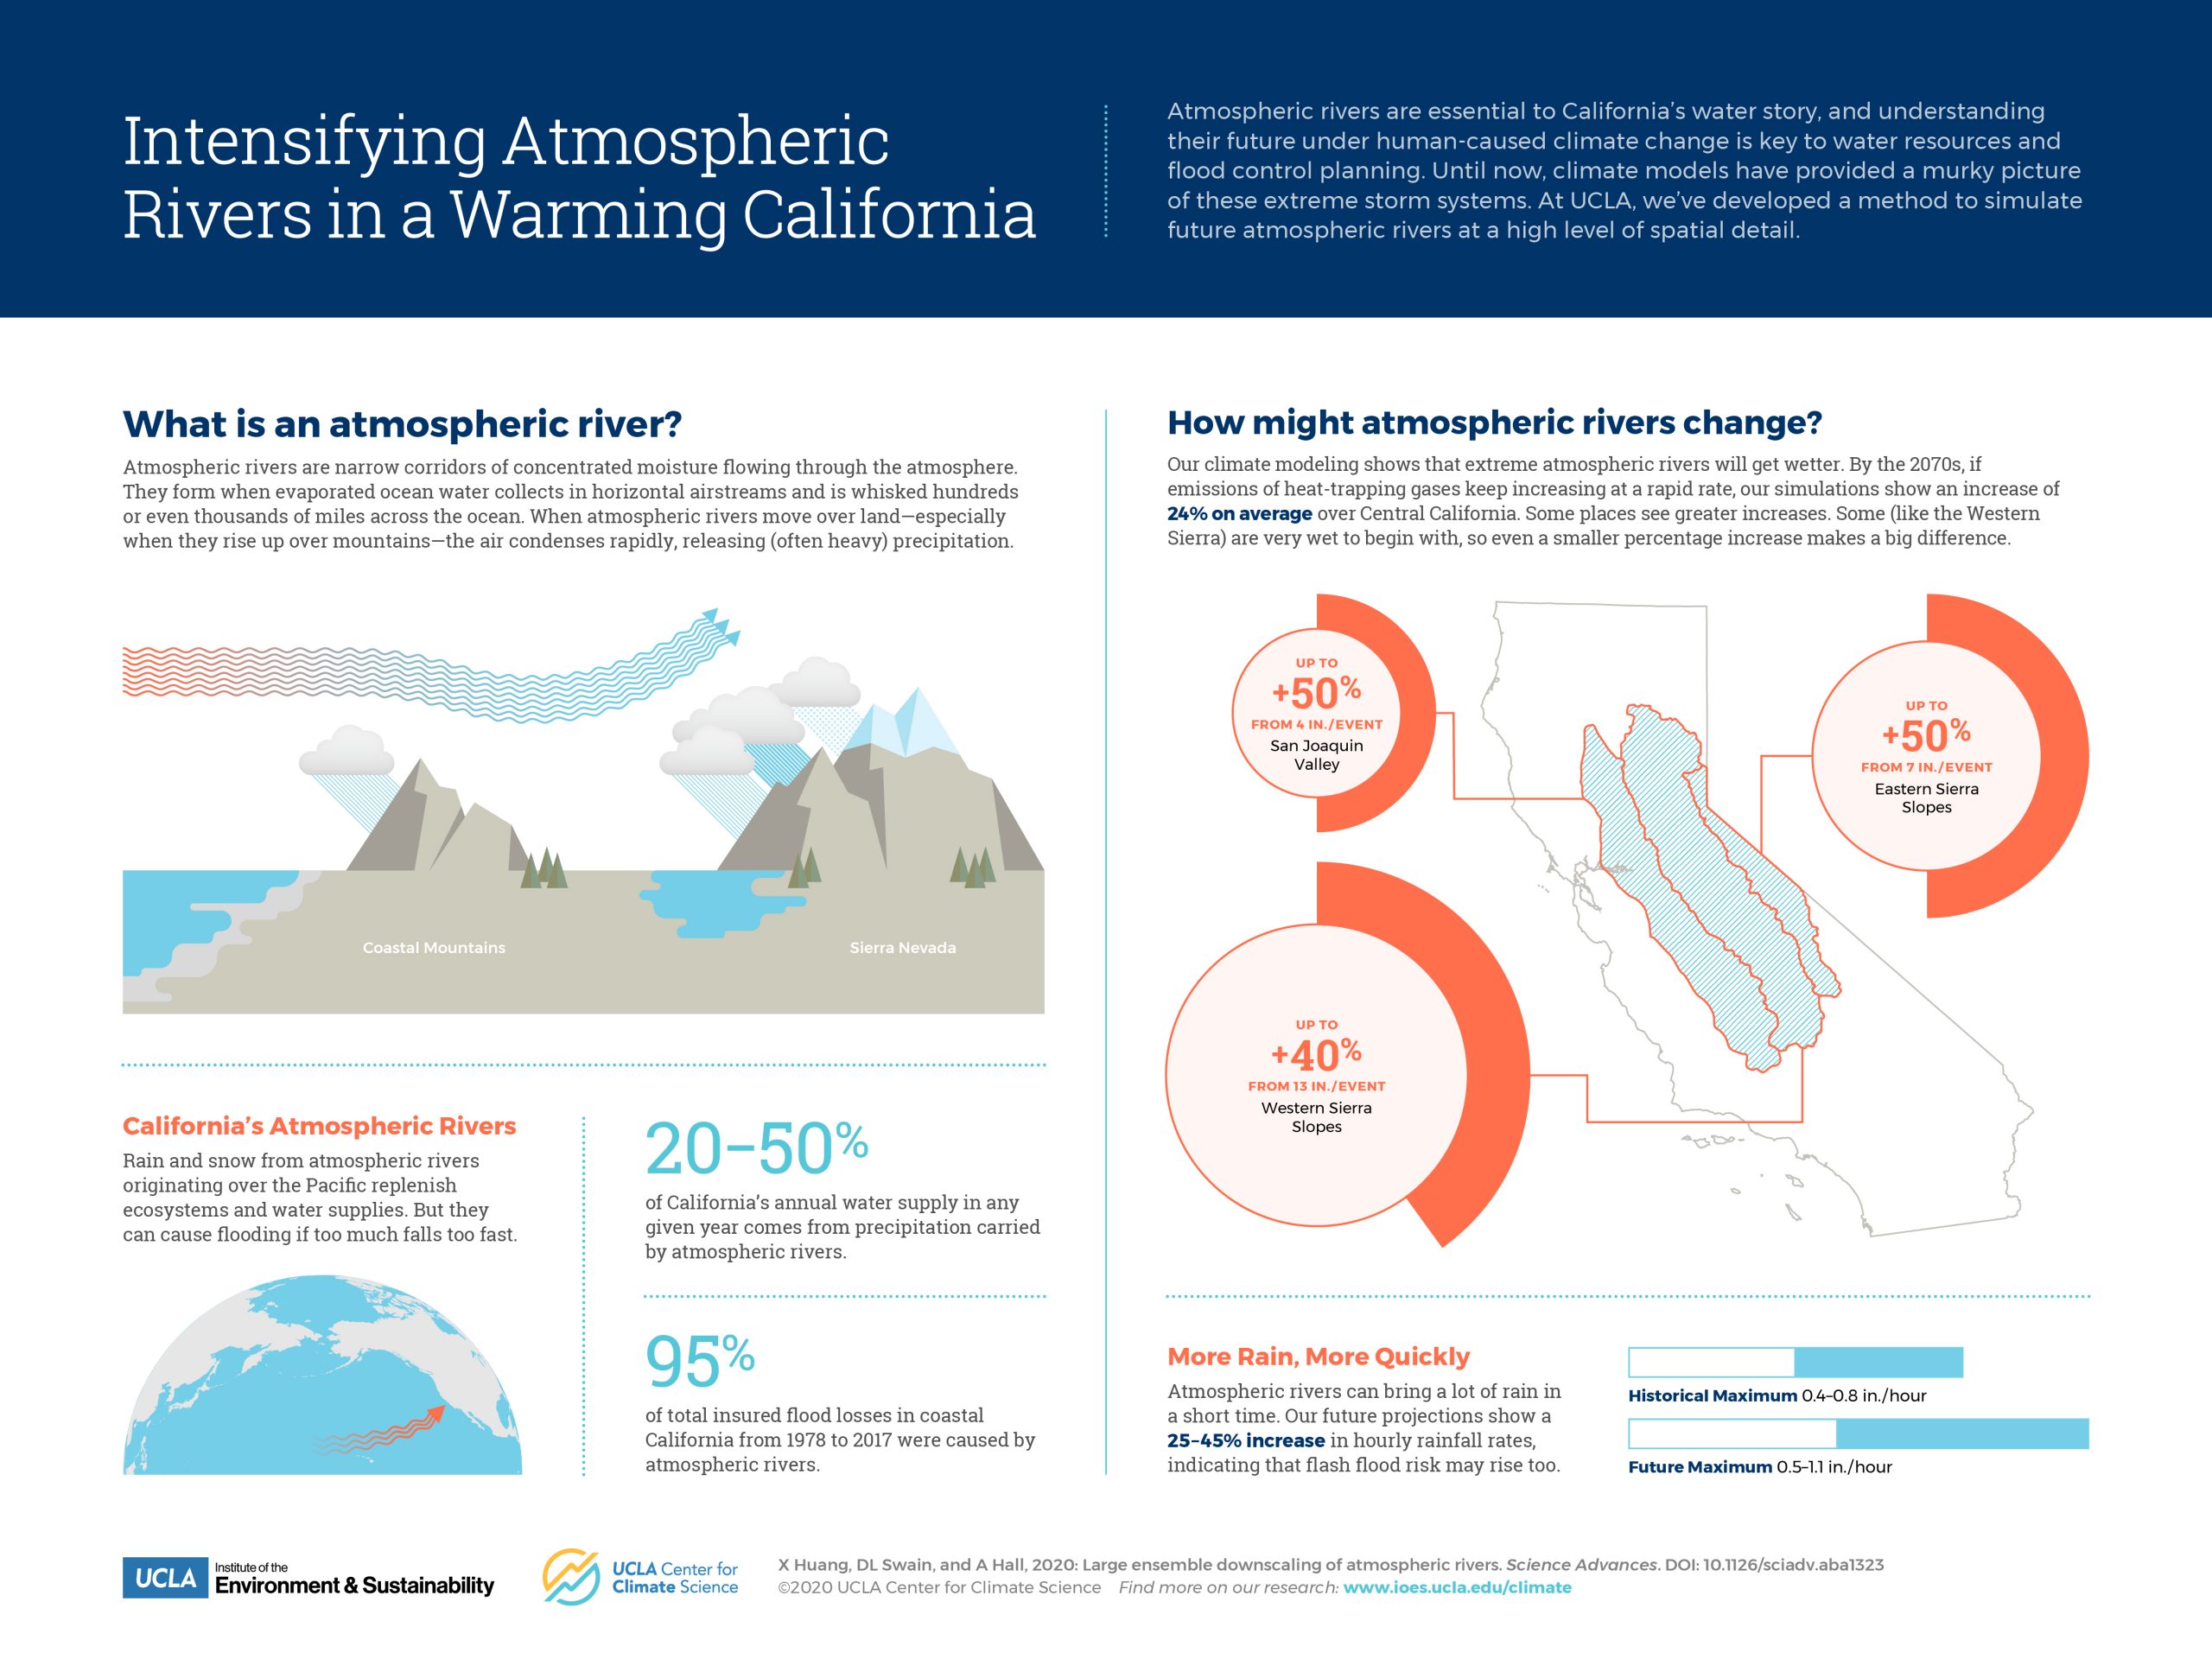
Atmospheric rivers in a California climate context
Atmospheric rivers (ARs)—long, sinuous corridors of water vapor in motion in the lower half of Earth’s atmosphere—are a key aspect of California’s cool-season climate. ARs are in many cases pretty unremarkable when they’re out over the open ocean, visible on satellite as a narrow ribbon of cloudiness and (usually) light precipitation. But when these moisture plumes attach themselves to wintertime low pressure systems and make landfall along the California coast, the consequences can be dramatic—prolonged heavy rain and mountain snow often result, along with sometimes powerful winds. AR-related precipitation is strongly orographic, meaning that it tends to be strongly modulated by local topography. As a result, the most dramatic AR-related precipitation totals usually occur on the windward (south and west-facing) slopes of California’s coastal and inland mountain ranges. Precipitation accumulations in such regions during the most extreme AR events are comparable to that received along the Gulf Coast or Eastern Seaboard during landfalling hurricane events—and are occasionally measured in feet, rather than inches. As such, ARs can be either blessing or a curse, depending on context and antecedent conditions: they are responsible for up to 50% of California’s overall water supply, but also the vast majority of the region’s flood risk.
The large ensemble approach: generating multiple plausible pasts and futures
Since ARs are such a fundamental aspect of California’s historical climate, it’s critically important to understand how such events are changing in a warming world. Existing research on climate change and ARs has previously suggested that the strongest events may intensify considerably in some regions. But nearly all such studies to date have relied exclusively upon global climate models—which are excellent tools for understanding how global and regional climate is changing in a broader sense, but are often not granular enough to assess changes in fine-scale phenomena like ARs. In the study I describe in this blog post, my colleagues and I have attempted to resolve this challenge by using a high-resolution atmospheric model (the Weather Research and Forecasting Model, or WRF—commonly used in making day-to-day weather forecasts) to simulate the “storms of the future” in great spatial and temporal detail. We do so by drawing initial large-scale atmospheric conditions from traditional, coarse-resolution climate model simulations and providing these to the weather model. In this way, we are able to systematically pick out individual extreme AR storm events from these extensive climate model simulations and simulate them using a tool that much better represents the small-scale variations topographical quirks that characterize California climate. We focus mainly on extreme ARs that have large impacts in the Sierra Nevada, so the study is centered primarily across central and northern California.
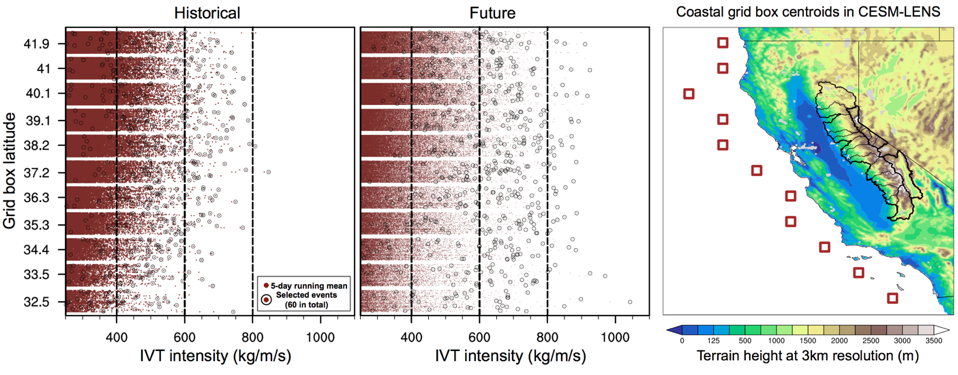
Importantly, this approach also lets us consider multiple “plausible pasts and plausible futures.” The climate model is part of a large ensemble of simulations, meaning that the simulations are repeated 40 times for the historical past and 40 times for a warmer future. This allows us to capture a wider range of possible storm sequences in both the present-era and future climate conditions—since we essentially have created a record of many dozens of synthetic but physically plausible extreme storms during each period. This means we have a large sample size to compare differences in storm characteristics between these two periods, which is much larger (by a factor of 40!) than would be available by looking at the historical record alone.
It’s worth noting that the future climate scenario we use in this work is one characterized by a continued increase in greenhouse gas emissions through most of the 21st century (RCP8.5, for the climate wonks out there)—a trajectory that is (hopefully) worse than we’ll actually take in the coming decades. Still, most of the impacts we consider in this work will emerge even on lower emissions trajectories—but more slowly and to a lesser degree, dependent entirely on our eventual success in limiting and eventually bringing to zero net global carbon emissions.
Stronger, wetter atmospheric rivers as the climate warms
We report substantial (20-30%) increases in AR-associated integrated water vapor transport, IVT. (IVT is an aggregate measure of AR strength that takes into account both the level of atmospheric water vapor and the strength of transport-level winds). It’s important to keep in mind that we’re assessing events that are quite rare and extreme—and it’s interesting to note that the composite IVT pattern for both present era and future extreme ARs looks a lot like the canonical “Pineapple Express” subset of ARs. That suggests that the largest plausible AR storms in California are likely to be events with a deep subtropical moisture tap, coinciding with a relatively amplified meridional flow pattern over the North Pacific with a strong upstream blocking ridge over the Bering Sea and a deep low pressure center just northwest of California.
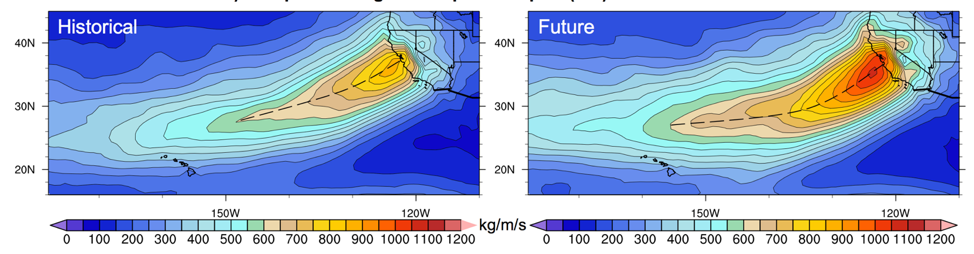
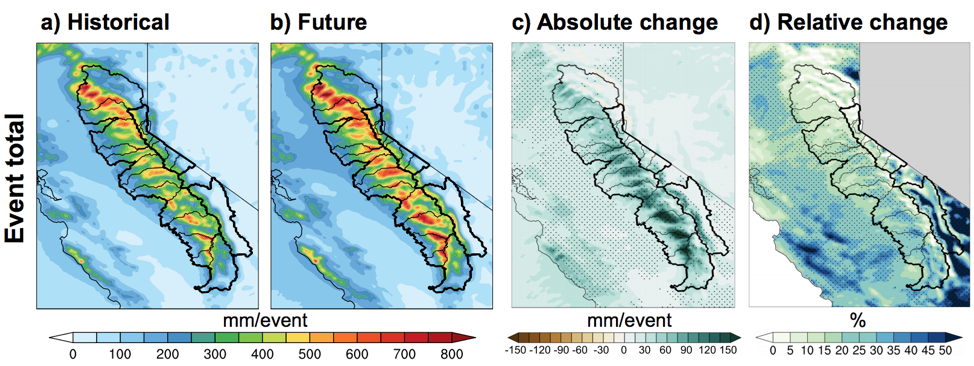
We find a substantial increase in the amount of precipitation that falls during extreme ARs in a warmer climate just about everywhere we look—but the largest relative changes are not always where you might expect. These increases range from 15-30% on the orographically favored western slopes of the Sierra Nevada and the coastal mountains, 25-40% in the flatlands and rain-shadowed areas of the Central Valley and smaller coastal valleys, and locally 50% or greater in the strongly rain shadowed lee side valleys in far eastern California and western Nevada. (Absolute increases, of course, are still greater in the orographically favored areas). This spatial pattern of extreme AR precipitation increase suggests that events may become somewhat less strongly orographic in nature—meaning that physical processes other than simple orographic uplift may become more important in a warmer future. This portends potentially outsized increases in precipitation in places not historically accustomed to seeing large volumes of AR-associated precipitation.
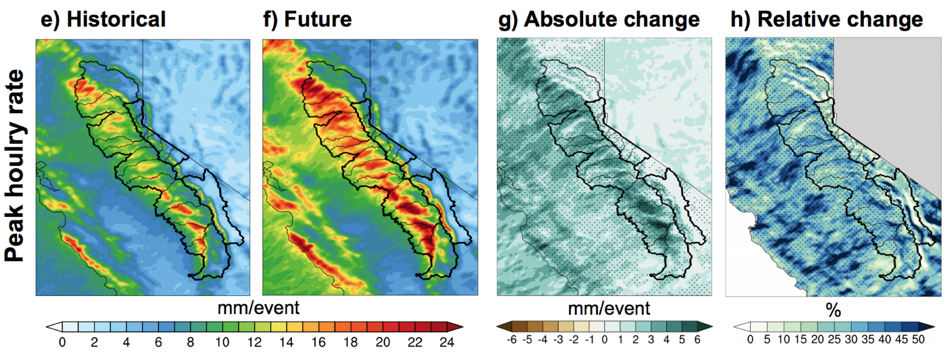
Strikingly large increases in the most intense hourly downpours
One of the advantages of using a high-resolution weather model in this investigation is that we can consider AR characteristics at high spatial and temporal granularity. When we did so, we found something quite striking: the increase in the most intense hourly precipitation during extreme AR events increases by a considerably larger increment and in a more spatially uniform way than event-total precipitation–30-50% just about everywhere. This means that the most intense downpours during extreme AR storms will become substantially more intense regardless of whether you’re on a southwest facing mountain slope or in the Central Valley. The spatial uniformity of this hourly maximum precipitation increase strongly suggest this, too, is not driven by orographic processes. What could it be instead? While we don’t directly diagnose the mechanisms in this paper, it may be the case that future extreme ARs in a warmer world are a bit more convectively unstable than what we’ve been used to historically. The vertical stability profile of contemporary is usually “moist-neutral” (for the meteorologists out there), meaning that an air parcel will rise without resistance if actively lifted (by orographic interaction, or frontal forcing) but won’t rise spontaneously due to its inherent buoyancy (as might occur during a summer thunderstorm, for example). Since the lower level atmosphere during future extreme ARs will be much warmer and moister, it’s possible that these lower level changes outpace those occurring higher up in the atmospheric column—leading to stronger moist convective instability. Now, this last bit is informed speculation on my part, but it’s something we definitely plan to take a closer look at in future work.
What’s going on here? It’s (mostly) down to thermodynamics.
The vast majority of these projected precipitation increases—around 85%–stems from the simple fact that the water vapor holding capacity of the atmosphere increases rapidly (exponentially, in fact) with rising atmospheric temperatures. While this doesn’t mean that atmospheric humidity will always be higher in a warming world, it does mean that when conditions are near saturation—as nearly always occurs in AR environments—this increased water vapor holding potential will be realized. As a result, the warmer atmosphere itself is directly responsible for a majority of the increase in water vapor transport, and subsequent precipitation, during extreme AR events in a warming climate.
The other ~15% of this increase arise from modest projected increases in the strength of westerly winds (in the middle atmosphere, around the level of the low-level jet) during extreme AR events. This additional contribution by future wind shifts is actually most pronounced across central and southern California, rather than in the north. This piece of the puzzle remains a bit more uncertain than the thermodynamically-contributed moisture increase, as different climate models don’t uniformly agree on whether these westerly winds will increase. But since the thermodynamic moisture increase is the direct result of a fundamental and well-understood physical process, all climate models do agree on that part—giving us very high confidence that ~85% of the IVT and precipitation increases we report would actually come to fruition in a much warmer future climate.
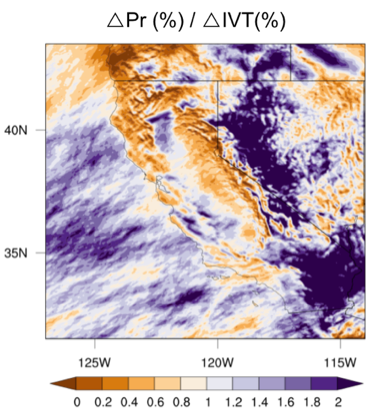
Two other findings are interesting from a thermodynamic perspective. First, our simulations suggest that the precipitation increase during future extreme ARs will lag the even larger IVT increase during such events. In other words: While both precipitation and IVT increase considerably, the precipitation efficiency (i.e., precipitation per unit IVT) actually decreases in a warming climate. This means that precipitation increases might not be quite as large as one might expect if extrapolating historical relationships between precipitation and IVT. Strikingly, however, this decrease in precipitation efficiency is mostly confined to the windward slopes and orographically-favored regions, and is much less prominent across the Central Valley and lee side valleys.
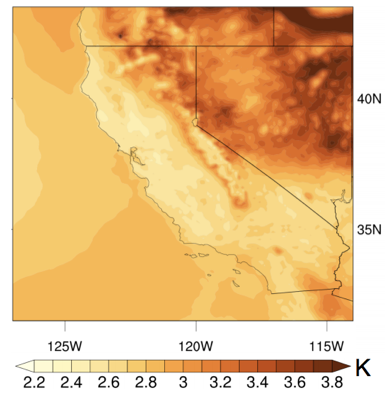
Second, we find that future California ARs will be much warmer than those which occurred historically. While that, in itself, is not a tremendously surprising finding, more intriguing is the fact that extreme ARs actually warm less than do background climate conditions (i.e., the warming during non-AR periods is stronger than during AR events). Our recent work has demonstrated that contemporary ARs are already warming substantially in California, though at less than the background warming rate (Gonzales et al. 2019)—suggesting consistency between recent observations and future model projections in that regard. Nonetheless: the 3-5+ F projected warming during these extreme ARs would be more than enough to fundamentally alter the rain/snow balance at higher elevations—meaning that the vast majority of precipitation during future ARs might fall as liquid rain (rather than snow) even at quite high elevations.
What does this all mean for flood and water management in California?
Our new work adds to a growing body of research suggesting that that California will face warmer, wetter storms in a warming climate. The resulting increase in extreme precipitation, and in the fraction of precipitation falling as rain rather than snow at higher elevations, will likely occur even in the absence of large changes in overall average precipitation. Indeed, in work published in 2018 (and discussed in detail in a previous blog post), we found that relatively modest projected trends in regional mean precipitation mask much a much more dramatic increase in “precipitation whiplash” between increasing wet and dry extremes. On top of this, warming temperatures are already driving an increase in hydrological drought conditions due to increased evaporation both in California and across the American West—further amplifying existing water management challenges and ecosystem stresses.
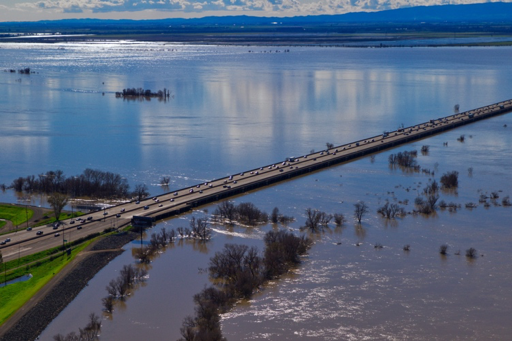
The combination of “wetter wet” and “drier dry” conditions superimposed upon warming temperatures poses special challenges in California. Warming temperatures are already increasing water demand both for human use and by natural ecosystems at the same time that warming is reducing the amount of water available—increasing scarcity in the long run. California’s modern water infrastructure is strongly predicated on the existence of a “time release” snowpack in the Sierra Nevada, which historically provided gradual replenishment of surface water storage in reservoirs through much of the dry season. With warming, the amount and reliability of water originating in this high elevation “snowpack reservoir” will decline—curtailing water supply. On the other hand, the combination of increasing precipitation volume and intensity overall, plus a much higher ratio of rain to snow in the mountains, will likely produce a large increase in storm runoff and a substantial increase in flood risk in most watersheds. This may have the paradoxical effect of increasing short-term flood risk but also long-term water scarcity, because wider safety and flood control margins at dams will need to be maintained—allowing for less wet season storage capacity behind these structures. Of particular note is the especially large increase in short-duration downpours within already extreme AR events in a warming climate. Higher hourly rainfall rates would preferentially increase the risk of flash flooding and debris flows in susceptible areas, in addition to the risks posed to larger watersheds from increased event-total precipitation.
One potentially promising approach to mitigate these competing risks is to essentially play one against the other. In other words: it may be possible to fight drought with flood, and vice versa. How might this work? Well, California’s Department of Water Resources (and other public & private organizations) are already exploring new paradigms including “flood-managed aquifer recharge” (FloodMAR). The basic idea is to take large pulses of water from big storms and allow it to spread out across pre-determined, strategically located floodplains. In some cases, this may serve to both reduce flood risk to urban areas (by taking pressure off of dams and levees) and reduce the risk of future water scarcity (by allowing a portion of the water released from surface water reservoirs/dams to be stored in underground aquifers, available for later use). Conveniently, these periodically inundated floodplains often serve as “pop-up” habitats for native and endangered species. If you’ve ever driven on Interstate 80 causeway bridge between Davis and Sacramento, you’ve seen a large-scale managed floodplain in action: The Yolo Bypass. While this particular example is used mainly to reduce flood risk (rather than recharge aquifers), conversations are actively ongoing regarding how successful existing projects, such as the Yolo Bypass, could serve as a model for future climate adaptation measures in a warmer, more variable California.
Just how much will flood risk increase due to these warmer, wetter storms? Stay tuned—we have further work currently in review (as of this writing) on precisely that topic. And we are presently embarking on new, large-scale extreme storm contingency exercise for California—ArkStorm 2.0. This statewide endeavor—which uses the large ensemble downscaling approach described in Huang et al. 2020 to develop physically plausible atmospheric river storm sequences—will be launching later this year, and will involve many of the same folks who were involved with the original “ARkStorm” and “ShakeOut” exercises. Much has changed in the atmospheric and climate science communities over the past decade, however, so we feel it’s critically important to provide an update consistent with the evolving state of the science (and the state of the world). Many details are still to be determined, but stay tuned for more in the months to come!
How is this article different from typical Weather West blog posts?
This special Weather West article focuses on peer-reviewed scientific research by my colleagues and me that has recently been published in Science Advances, and also discusses peer-reviewed work by other scientists. This means that the content of this piece is based upon findings from formal scientific investigations by teams of researchers, which contrasts with more typical Weather West posts that are primarily based upon my own informal thoughts and analysis. I would like to thank my co-authors in this work—Xingying Huang and Alex Hall—for their sustained efforts in bringing this project to completion. (This work evolved over several years from its initial conceptualization to final publication.) Funding for my contribution to this research was provided through a partnership between UCLA’s Institute of the Environment and Sustainability, the Capacity Center for Climate and Weather Extremes at the National Center for Atmospheric Research, and The Nature Conservancy of California.
A fully open-access version of the paper (freely accessible to all!) can be viewed here.
The web-sharable infographic illustrating key points from our extreme atmospheric river work found at the beginning of this blog post may be reproduced for any purpose with proper attribution. I’d like to thank science communicator Katharine Reich and graphic designer Rebecca Hume for making this possible!
Citation: Huang, X., Swain, D.L., and A. Hall. Large ensemble downscaling of extreme atmospheric river storms in California reveals large increase in fine-scale precipitation, Science Advances, doi: 10.1126/sciadv.aba1323.