Near-shore Pacific Ocean temperatures have now reached astonishing, record-breaking levels along nearly entire California coast
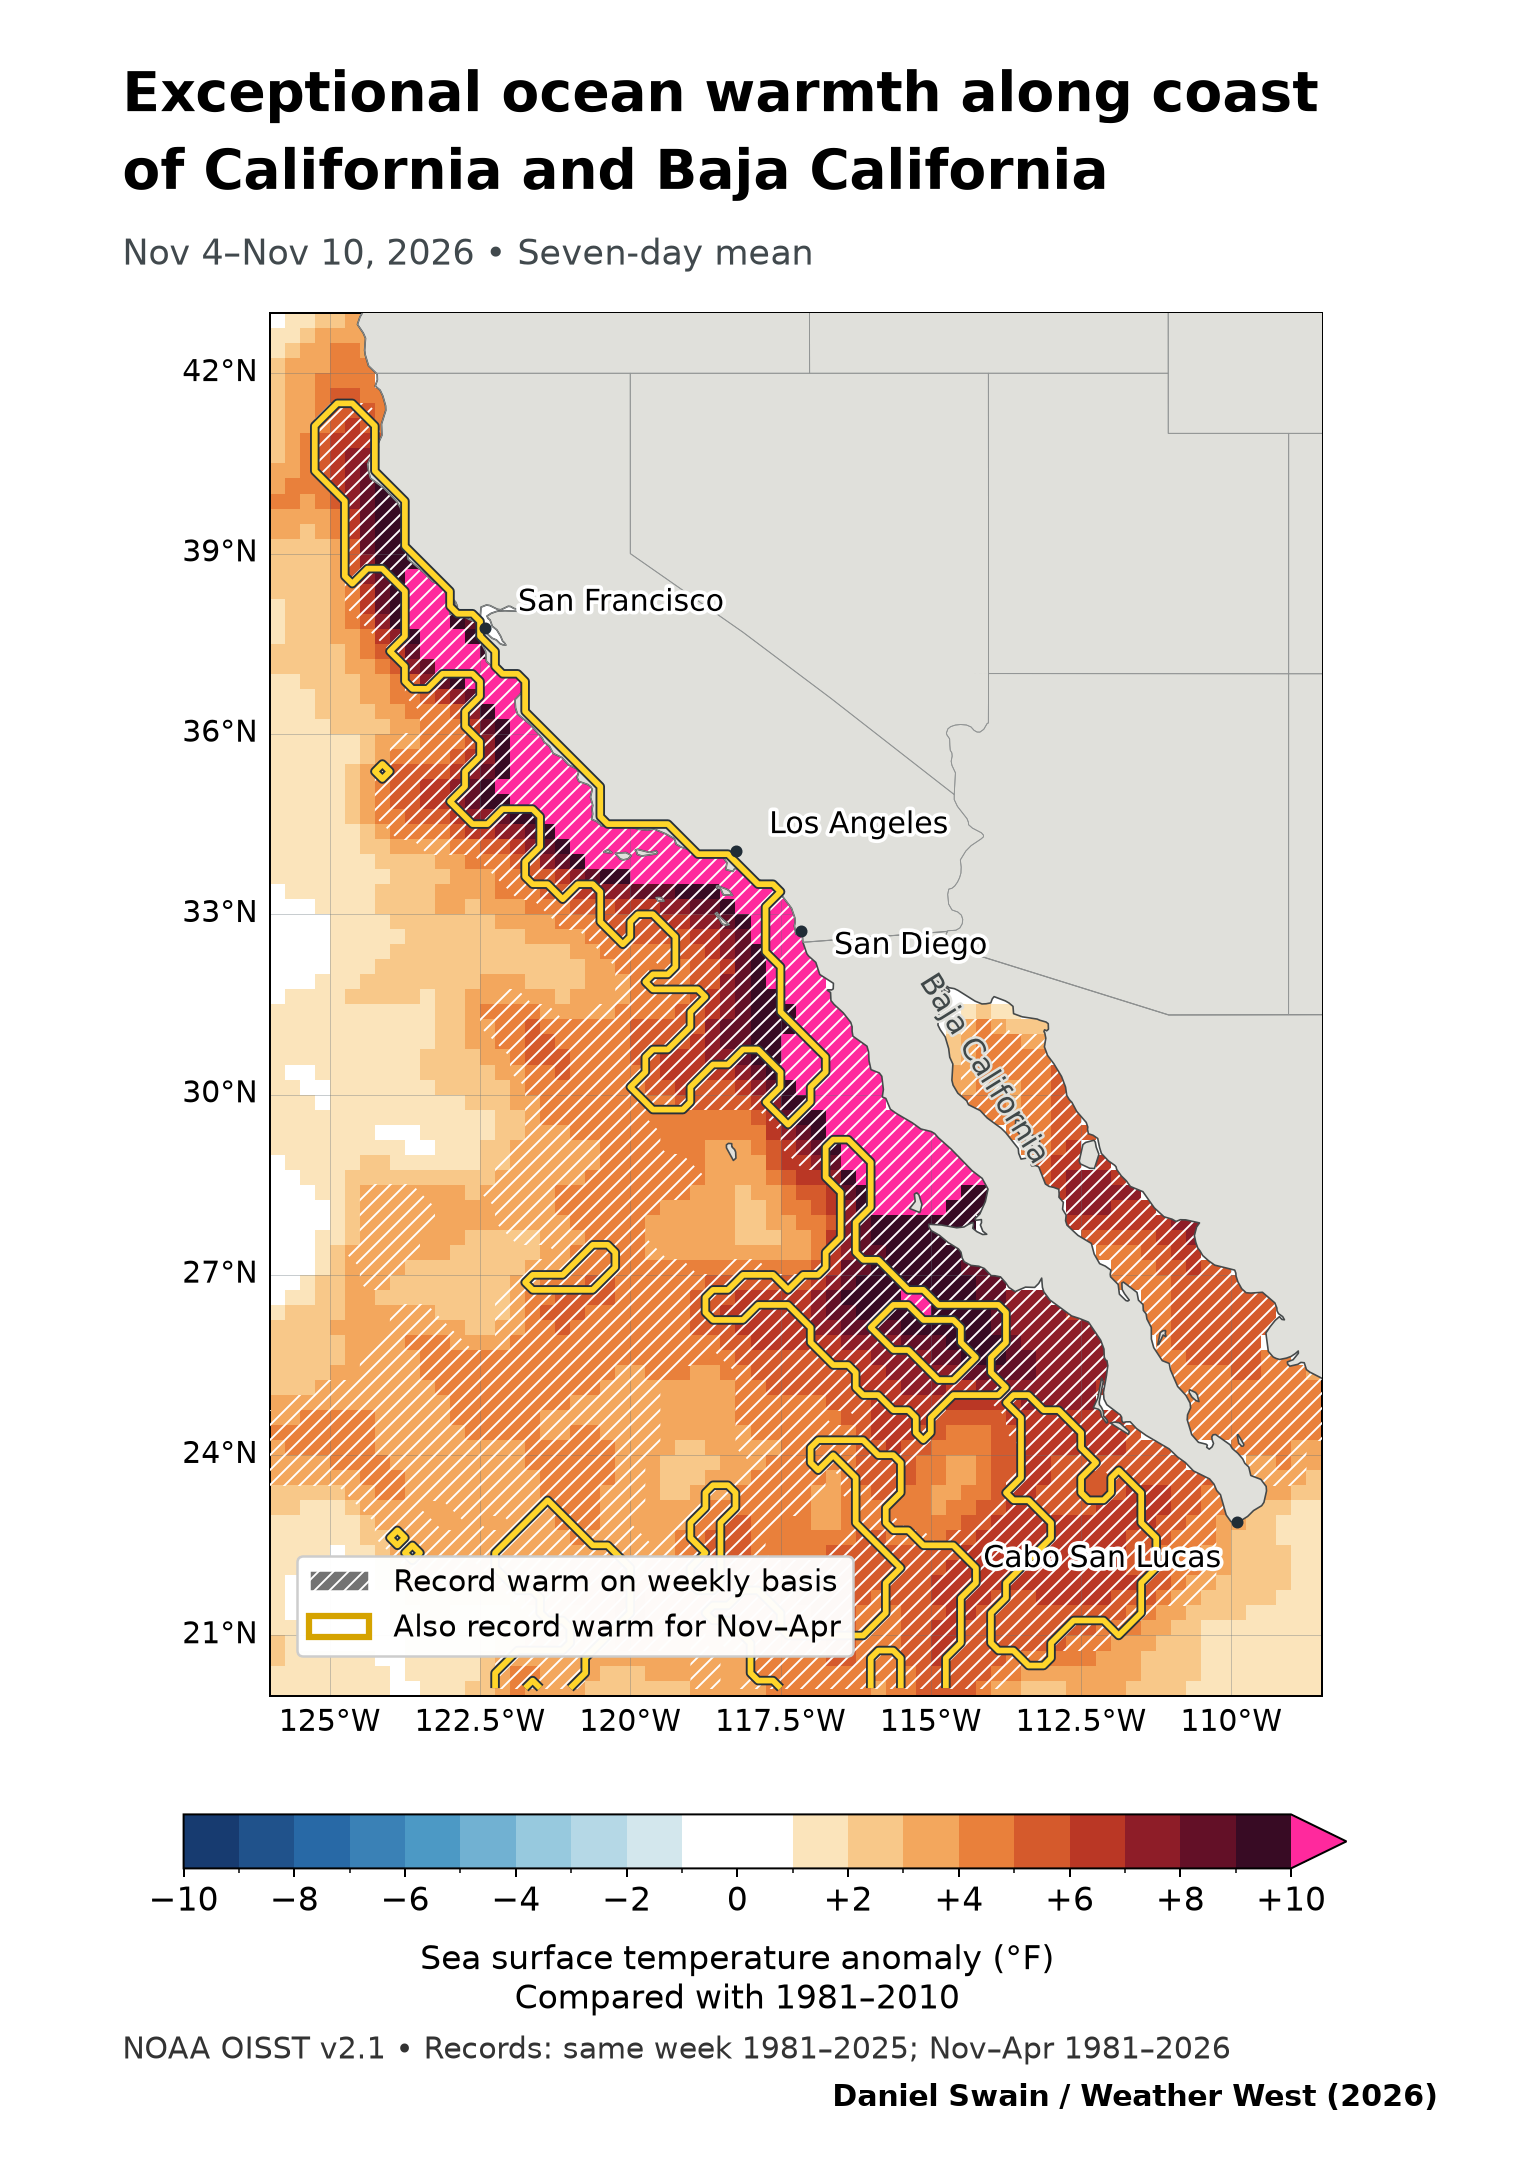
Just case you haven’t already noticed: Current ocean conditions along the California coast are presently just about as far from typical as one could possibly imagine. Water temperatures within about 20-30 miles of shore have reached exceptional, extraordinary, astonishing (running out of superlatives here) levels in recent days, and are now running more than 10°F warmer than average in a contiguous, unbroken region from Punta Eugenia in central Baja California northward to the Sonoma County coast (with “lesser” 5-8 degree anomalies continuing all the way up to the Oregon border). These values are unquestionably record-breaking, and have over the past week progressed even farther beyond that to become “record-shattering” in many areas: Not only are current ocean temperatures the warmest on record for the calendar date along the entire California coast (except for a small area near Crescent City), but they have now reached levels that would be record-breaking for any cool-season (Nov 1-Apr 30) week in the entire period of record (which begins with the satellite era in 1981) all the way from Newport Beach northward to Eureka. Never in our lifetimes has the water been this warm, this late in the season, along the California coast–and in many cases by a considerable margin.
These are the kind of anomalies that made me do a double take, and recheck the data to make sure it’s not in error–it’s just that incredible. But I promise that it’s real, and corroborated by a growing number of direct and indirect sources and observations. The oceanographic, meteorological, and ecological implications are and will be profound: thermal expansion of sea water is causing coastal ocean levels to run at least 6-12 inches above average, coastal humidity and temperatures are greatly elevated (and will contribute extra moisture and energy to inbound Pacific storms), and we’re already seeing certain subtropical marine species arrive in parts of California where they’ve never been seen before (even during previous very strong El Niño events).
What’s causing this extreme and record-breaking marine heatwave? It’s a combination of El Niño–extreme and, by some metrics, already record breaking in its own right–building on a pre-existing marine heatwave that is itself amplified by long-term ocean warming (caused by human-caused climate change). Future attribution studies will undoubtedly quantify the exact contributions from El Niño, climate change, and other factors; I can’t do that in a blog post. But it’s certainly the case that this highly extreme event is result of multiple natural and human-caused factors “stacking” atop each other.
What is the relative contribution of this extreme oceanic warmth to greatly elevated coastal water levels along the California coast in recent days and weeks? It is considerable. My estimate is around ~12 inches of the total persistent 12-18 inch ocean height anomaly comes from thermal expansion of seawater (1-3 inches from the super warm surface layer, and the remaining 9-11 inches from deeper subsurface warming). Each additional coastally-trapped Kelvin wave that arrives this season–and there will likely be at least a couple more–could add another inch or two to that already large number. While it is possible that an unanticipated period of upwelling causes abrupt cooling at some point, that seems pretty unlikely, as the seasonal forecast from the ECMWF ensemble suggests a high likelihood of these extreme SST anomalies along the immediate coast persisting through at least January or February.
Widespread and possibly heavy rainfall headed for much of California in across several successive waves, each associated with a well-defined cold front
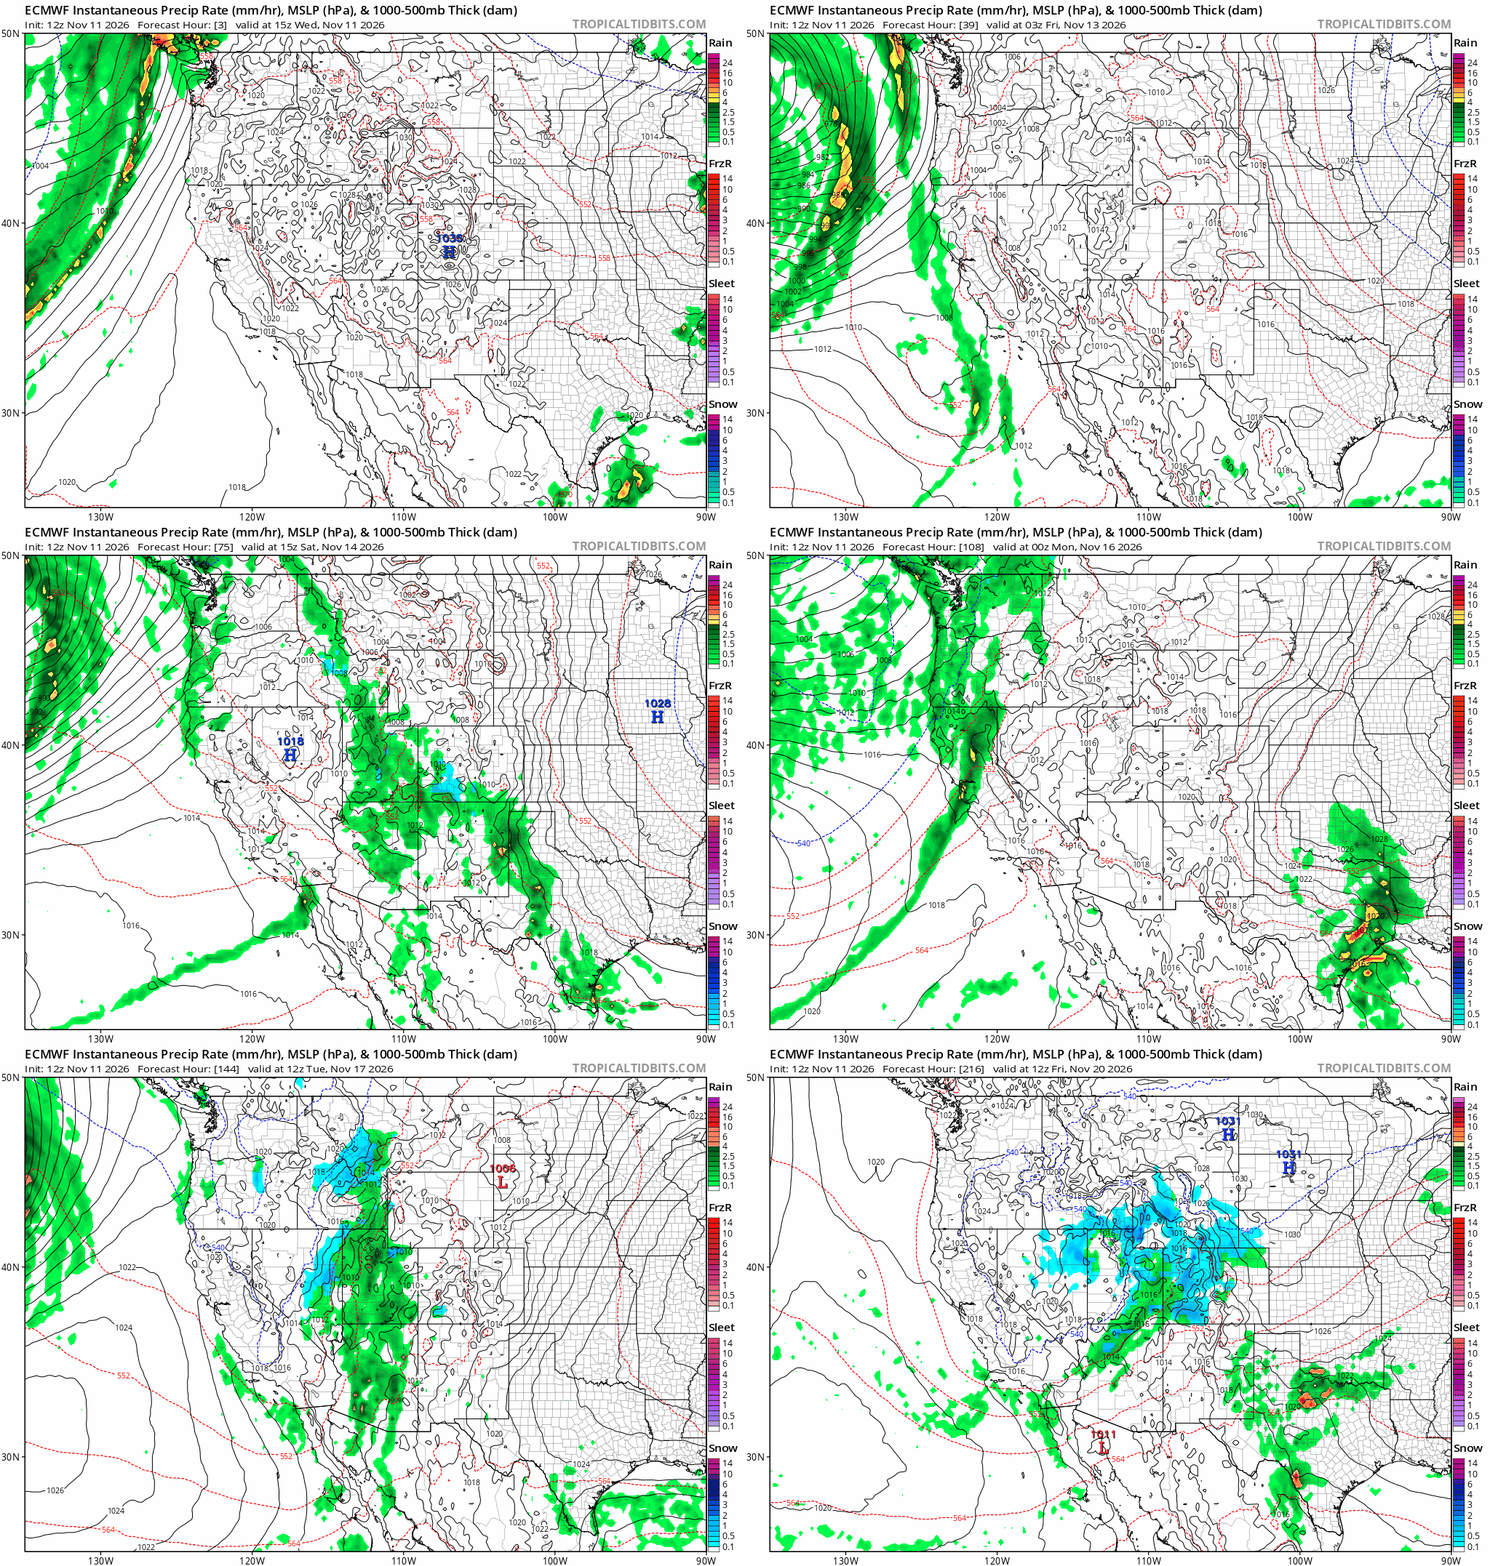
Well, after much Weather West comments section consternation, the long-awaited storm sequence appears poised to materialize in the coming days–with the first arriving in Northern California on Friday (just 48 hours from now). In fact, this now appears to have the potential to become a rather impressive storm sequence for so early in the rainy season, with ensemble average rainfall accumulations across much of California over the next 14 days generally exceeding average totals for the entire month of November!
Flood risk looks pretty modest, as across most of NorCal this will be the first significant/heavy rainfall of the season. But it will begin to prime watersheds for faster responses during subsequent winter storms later in November into December and beyond, which I suspect will be numerous. And there could still be the usual “first of the season” issues with urban/roadway ponding in poor drainage areas due to autumn leaf-clogged storm drains and etc. The good news? This should finish off what remains of what has been a rather mild fire season in California (notably distinct from fire season across most of the rest of the U.S. West, which “ex-California” was actually among the worst on record).
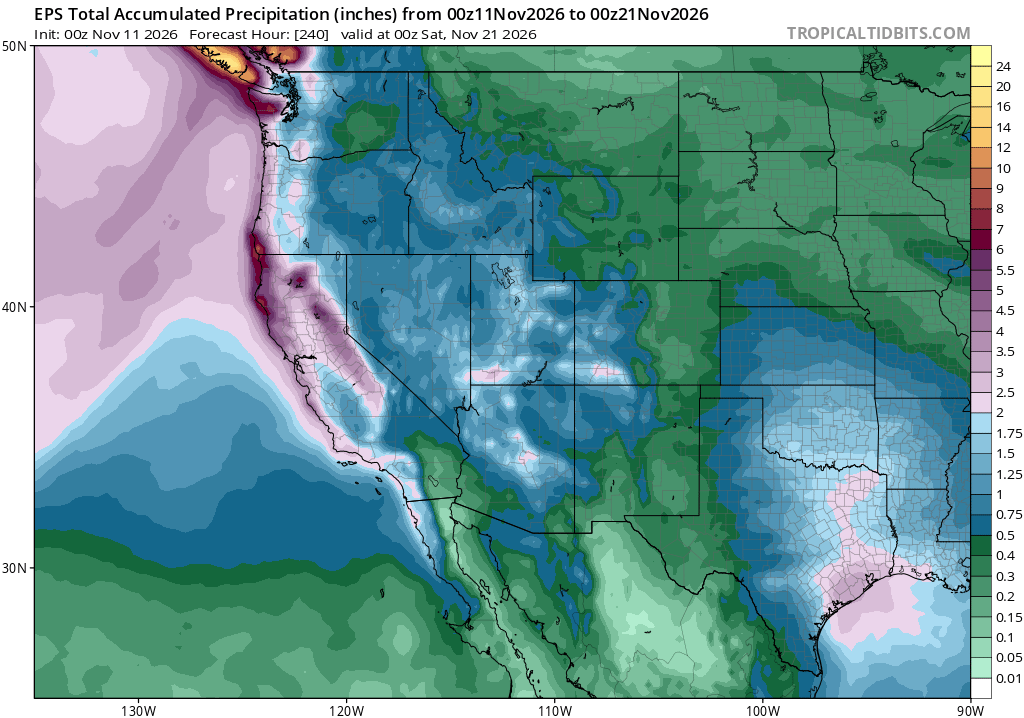
Each of these systems, and it looks like there will be at least 3-4 of them in relatively quick succession with gaps of 2-3 days in between, will be associated with a fairly well defined cold front. Models have been waffling back and forth considerably regarding exact trajectories, which will affect whether there will be any notably strong cold frontal passages or only more moderate ones. If we do get a stronger storm or two during this period, it could feature not only a period of widespread heavy rainfall and strong gusty winds but also possibly some thunderstorm activity, as it appears these systems will be associated with both a) a fairly strong overhead jet stream and b) cold air aloft over the aforementioned very warm near-shore SST (and, thus, steep lapse rates/increased atmospheric instability). I suspect that increased convective potential, including unusually widespread thunderstorm activity than is historically typical with California winter storms, may be a signature of our big El Niño winter this year.
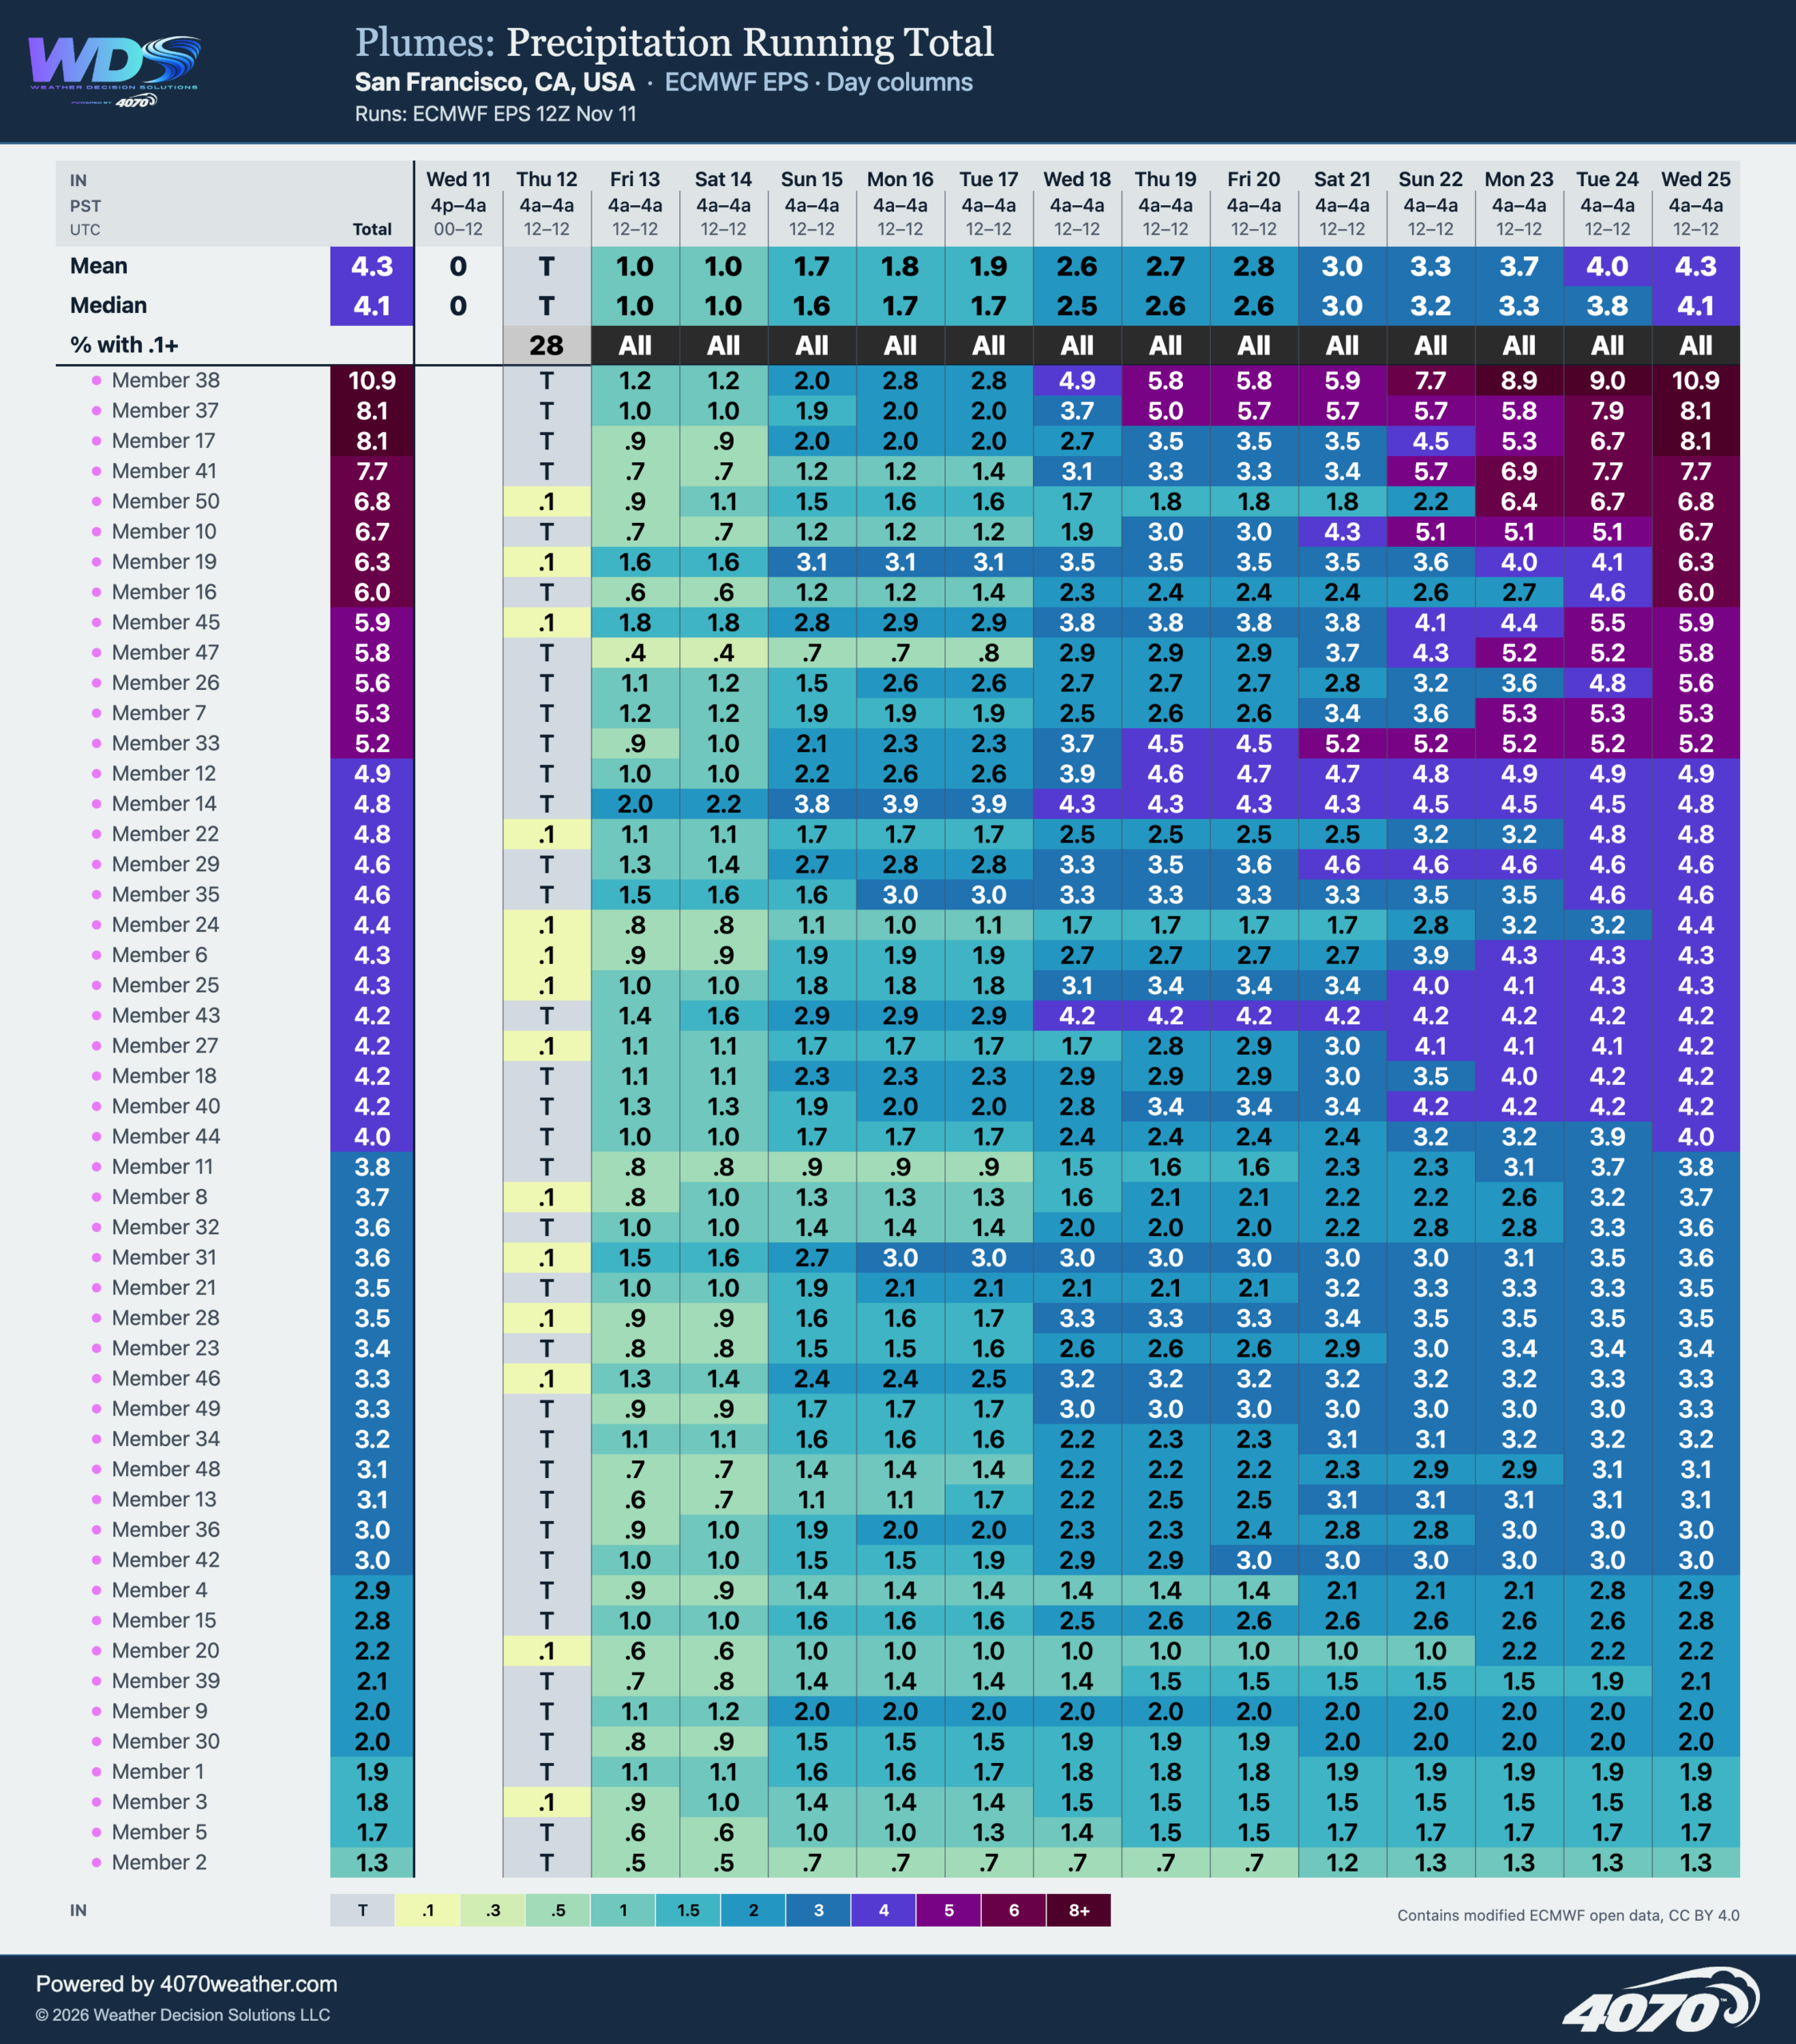
While this rather abrupt, though long-anticipated, pattern change will be primed to soak NorCal, there’s a good chance of significant precipitation in Southern California as well (it just might take a few more days for more significant rainfall to reach SoCal). In fact, if the current forecast holds, there’s a good chance that the entire state of California will end up with above-average precipitation for the month of November, despite the dry start up north.
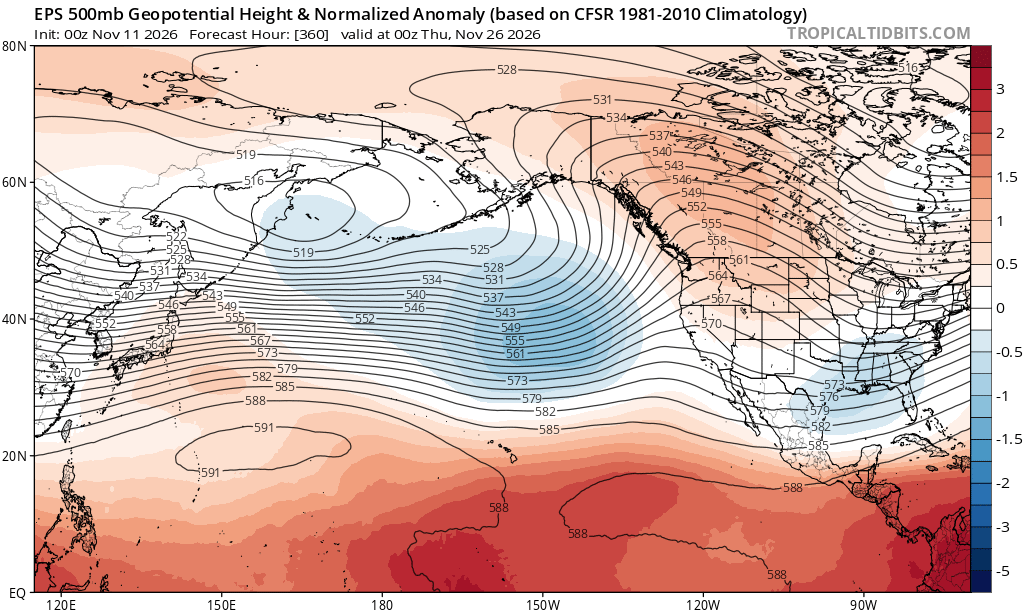
El Niño-like pattern appears to be developing across North Pacific, and if anything it’s a bit ahead of schedule
El Niño, of course, is already here and of very strong to historic strength (depending on how it’s measured). The latest forecast update from global modeling centers suggests little change in the already extraordinary outlook for California this winter, with a continuation of greatly elevated odds of a wetter-than-average winter (and perhaps even an extremely wet winter) statewide. Many seasonal modeling systems are continuing to produce their wettest forecasts ever issued at seasonal scale for California–exceeding even re-forecasts for the infamous 1997-1998 event and going far beyond their more middling retrospective predictions for the 2015-2016 events (very strong El Niño, but not very heavy CA precip). The odds that at least one, and possibly more than one, month between December and March will be *extremely* wet, with considerably elevated California flood risk, remains notably high (especially from about Mendocino County southward, but even extending up to and perhaps beyond the Oregon border. So yes: this does include the SF Bay Area and Sacramento region.)
More immediately concerning continues to be the rising risk of significant coastal erosion and flooding as we begin to approach the period of maximum astronomical tides–known as “king tides”–between late November and late January. Actual water levels during the king tide periods this year, which will unfortunately overlap with the major winter holiday travel periods, will likely be at least 1 foot and possibly 2 feet above typical levels. If a storm occurs during any of these specific windows–even a moderate one–water levels could rise yet further, as much as an additional 1-2 feet. So I am anticipating widespread disruptive and possibly damaging coastal flooding, thanks to the extreme El Niño overlapping with king tides plus other factors (including, you guessed it, long-term sea level rise from climate change!). It is quite possible that we could see record-breaking water levels, and record-breaking coastal flooding, during these episodes.
Accordingly, this week, I updated my El Niño fact sheet (available via both UC Agriculture and Natural Resources and Weather West); please do check it out and share widely!
And finally: Are we seeing signs of and “El Niño-like” large-scale pattern developing across the North Pacific? I think so, and if anything it’s a bit earlier than expected (it can sometimes take until December or even January for the seasonal cycle to favor full coupling between El Niño-related ocean anomalies and the North Pacific jet stream and storm track). But this year, the large-scale pattern consistently showing up in ensembles has a distinctly “very strong El Niño flavor”–characterized by a persistent Gulf of Alaska trough, upstream subtropical ridge to the northwest of Hawaii, and strong mid-level geopotential height gradients between the tropics (unusually high heights) and mid-latitudes (unusually low heights)–leading to accelerated zonal geostrophic flow (i.e., stronger/eastward-extended jet stream). It’s the kind of pattern we’d need to see for an active California storm pattern, and it’s beginning to materialize. While I would not be surprised if there is a break period, with drier/warmer weather once again later in November into early December, all systems still seem go from a big El Niño winter perspective in California–and I would recommend planning accordingly.
YouTube livestream discussion on upcoming storm pattern, coastal flooding risk as king tides approach, and extreme ocean warmth: Thu, Nov 12 at 11am PT
I’ll discuss all of the above, and more! Also: thanks to Weather West supporters continuing to support my weather and climate communication efforts, the YouTube channel now has over 25,000 subscribers! (Subscribing is free, helps grow the audience, and also allows you to turn livestream notifications “on” if you haven’t already.) See you there!
Discover more from Weather West
Subscribe to get the latest posts sent to your email.