Climate change is narrowing and shifting prescribed fire windows in the western United States
Note: This special Weather West article focuses on new peer-reviewed scientific research, recently published in the journal Communications Earth and Environment, that I led with the help of a team of collaborators from UC Merced, UC Berkeley, The Nature Conservancy, and Washington State University.
What is prescribed fire, anyway?
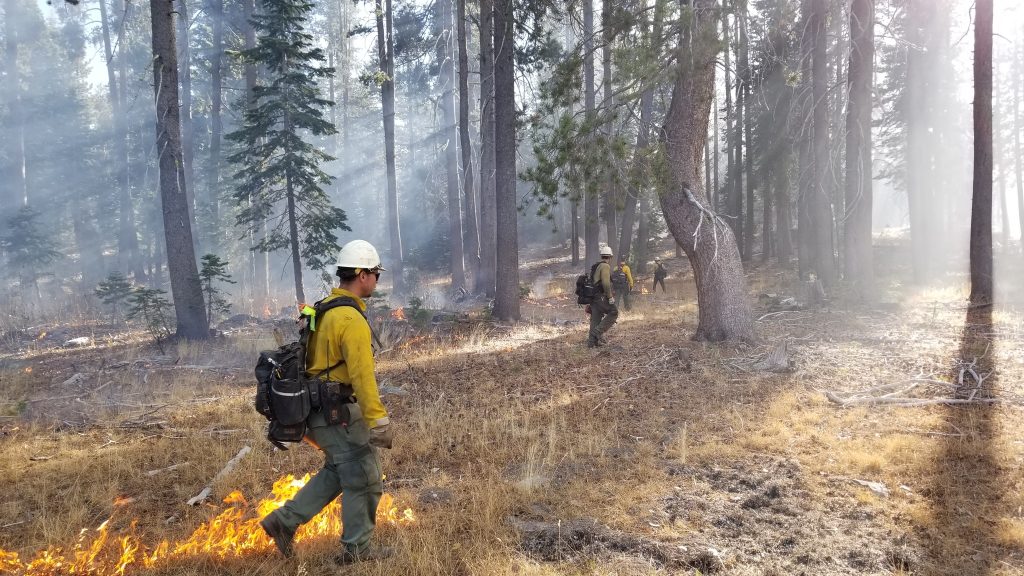
The American West, as well as many other fire-prone regions globally, have been experiencing a large increase in the level and severity of wildfire activity in recent decades—a trend that has wrought a growing human toll both directly (though loss of life and structures) and indirectly (though harm to ecosystems and watersheds, increasingly extreme smoke-related air pollution episodes, and even regional effects on housing availability or affordability). This escalating “wildfire crisis,” as it has been termed, has arisen from a confluence of aggravating factors—including the harmful legacy of historical fire suppression policies, increasing development in fire-prone areas, and the vegetation-aridifying effects of climate change. This increasingly stark reality has been been met with growing calls for both short-term interventions and long-term solutions.
Prominent among proposed strategies in addressing this challenge is the use of prescribed fire (also known as controlled burning), which is the practice of intentionally igniting and managing fire under prescribed conditions to meet specific desired hazard reduction or ecosystem-related objectives–including the reduction of wildland fuel density and improving ecosystem health and resilience to a warming climate and other disturbances. Prescribed fires in the western U.S. are generally conducted by fire personnel with state or federal agencies, though private landowners and nonprofit entities are increasingly conducting prescribed fires as well. Cultural burning is a related practice involving the use of fire by Indigenous peoples that includes some goals overlapping those of prescribed fire (management of natural landscapes in a way that ultimately reduces vegetation density and subsequent fuel loading), but that also holds much broader cultural importance and is practiced using a more holistic knowledge of place to guide the timing and implementation of burning activities. The study discussed in this blog post is focused on prescribed fire as practiced by government agencies and other organizations that follow their standards (e.g., The Nature Conservancy), but the issues explored have relevance to cultural burning as well given the importance of ambient weather and vegetation conditions in both settings.
There’s also one additional bit of nuance here that’s important to mention up front: our research is focused specifically on the constraints placed on the implementation of prescribed fire by weather, climate, and vegetation moisture conditions. We don’t directly consider additional but important factors like plant phenology, animal migration, or government regulations. Ultimately, we set out to answer the question: How many opportunities for prescribed fire are there in the American West under a “hypothetical best case scenario” where the only limiting factors are weather and climate, and how might that change in a warming climate?
To what extent do weather, climate, and vegetation conditions shape Western U.S. prescribed fire windows?
In this work, we used both observed weather and climate data (from the GridMET database) and downscaled climate model simulations (derived from the CMIP5 experiment) to determine both the baseline occurrence of and trends in environmental conditions conducive to safe and effective prescribed fire (we call each day that locally meets such criteria an “RxDay”). How, exactly, do we determine what those conditions should look like? Well, the basic idea is pretty simple: in most cases, prescribed fire practitioners want vegetation conditions to be in a “Goldilocks-like” range—not so damp that it inhibits combustion efficiency (or prevents it altogether), but also not so dry that combustion is very intense. Then, ambient weather condition, like temperature, relative humidity, and wind, also need to be within certain ranges to ensure both the success and safety of the burn (burning dry vegetation under especially hot, dry, and windy conditions, for example, generally doesn’t happen due to the increased risk of the fire escaping control and becoming a wildfire).
How did we determine the exact parameters for the purposes of this study? My co-authors went to the (considerable!) effort of manually compiling written burn plans from nearly two dozen actual prescribed fires completed by a range of agencies and entities (including the U.S. Forest Service, National Park Service, and The Nature Conservancy) and extracting the allowable range of environmental parameters from each. We then calculated the median values of the respective minimum and maximums for all relevant weather, climate, and vegetation parameters, using them to create a composite “prescribed fire acceptability” index separately for forested and non-forested areas. Finally, we applied those criteria to both observed and climate model data—calculating how many RxDays there were, on average, across the American West in the past and in a warmer climate future.
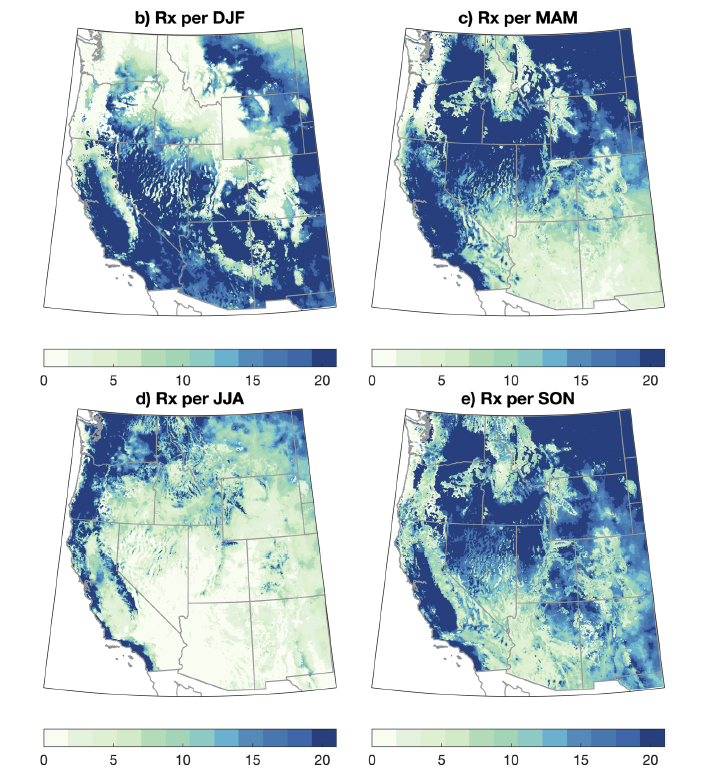
We find that the occurrence of days favorable for prescribed fire from a meteorological and vegetation moisture perspective varies widely across the Western U.S., from fewer than 10 days per year in extremely moist regions of western Washington and Oregon to greater than 70 days per year in multiple subregions, mainly those characterized by non-forest vegetation types. Most of the non-forest covered portions of the WUS (as well as some forested regions) experience at least one cumulative month (30 days) of RxDays per year, and many non-forested areas experience two or more cumulative months (60 days) of RxDays per year. Strong seasonal variations are also apparent: RxDays are maximized during winter in the Southwest and in summer in the Northwest. This overall seasonal progression essentially follows the latitudinal cycle of the polar jet stream and associated precipitation-bearing storms. Collectively, these baselines highlight two things: 1) The widespread climatic potential for prescribed fire to be used across a diverse range of regional sub-climates throughout the Western U.S., and 2) The fact that prescribed fire conditions on the ground vary in quite different ways from season to season depending on where, exactly, one is in the U.S. West.
Climate change will decrease overall opportunities for prescribed fire in the Western U.S. But…there’s also more to the story.
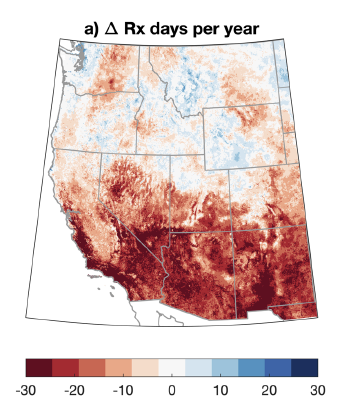
The headline from this work, as you might have surmised from the title, is that changes in meteorological conditions and vegetation moisture associated with climate change will, in most parts of the American West, decrease the overall number of RxFire days as the planet continues to warm. But we also find quite wide sub-regional variation in this projected trend. At 2°C (3.6°F) of global warming relative to a preindustrial baseline, strong RxDay declines will be widespread throughout the Pacific Southwest and southern portion of the Four Corners region, especially across California, Nevada, Arizona, New Mexico, along with much of Utah and Colorado. In fact, projected decreases in the number of RxDays exceed 30 per year within 50 miles of the central and southern California coast, Southern Sierra Nevada (and Sierra lee/eastern slopes more generally), and middle to upper elevation parts of Arizona and New Mexico (though slightly less so along the Mogollan Rim itself).
Much weaker trends, however, emerge at an annual scale across the northern tier of the Western US. Although even here more areas see weak (<5 days/year) to moderate (up to 15 days/year) decreases than increases, the projected magnitude of change is overall quite a bit lower north of about the 40th parallel. Many regions across the northern tier see little change in total RxDays, and some spots (especially portions of the Northern Rockies in southwestern Montana) even see small increases in the annual number of RxDays!
But, as prescribed fire practitioners have almost continuously emphasized for years, environmental conditions (i.e., weather, climate, and vegetation) are only one constraint of many when it comes to actually putting good fire on the ground. It can be too damp to burn effectively, or too hot, dry, and/or windy to burn safely—but even if all of these factors are in alignment, external considerations having nothing to do with the favorability of ambient conditions all too often prevent more frequent or more widespread prescribed fire treatment of landscapes that would benefit from it.
Chief among these limitations is the lack of available personnel: in the Western U.S., the same wildland fire crews that are more frequently tasked with suppressing wildfires are usually the same ones responsible for staffing prescribed burns. At the federal level, most of these folks are seasonal employees—they are not retained through winter once fire season has “ended.” These (often overworked and almost universally underpaid) crews are, increasingly, fully occupied suppressing active and potentially hazardous wildfires over increasingly long fire seasons that now extend farther into autumn and begin earlier in spring than they used to. In other words: the Western wildfire situation has escalated rapidly while funding and staffing have not kept pace—and prescribed fire treatments have often fallen by the wayside as a result.
There are also smoke-related challenges associated with public perception and air quality regulatory frameworks. Why is this important? Well, combustion of any kind of vegetation produces smoke and fine particulate matter pollution—be it an uncontrolled wildfire, a planned prescribed fire treatment, or even a log burning in your living room fire place. But some fires produce much more smoke than others. Prescribed fires, for the most part, burn at a lower intensity than their unmanaged and unplanned counterparts and produce less smoke overall. That’s partly because considerable effort often goes into preparing areas in advance for safe and effective prescribed burning, and partly because prescribed fires are essentially never conducted under the most extreme burning conditions (which, by contrast, is precisely when unplanned wildfires tend to occur). Prescribed fires (conducted under moderate weather/vegetation conditions) generally do not consume nearly the same volume of biomass as high-intensity wildfires burning under extreme conditions, so the total volume of fine particulate matter pollution generated is generally less (and often dramatically so).
Many folks who live in areas affected by smoke from wildfires and/or prescribed burning are, understandably, concerned about the health impacts of breathing smoky air. (I know I am!) But since it’s universally agreed by ecologists and fire scientists that there’s no “no fire” option in the warming West, the relevant question then becomes: Would you rather see smoke in more modest concentrations and for shorter periods of time (from increased prescribed burning) or in increasingly extreme “smokestorm” episodes driven by larger, more intense, and longer-lasting wildfires (recall autumn 2020 in California)? As both a scientist and a resident of the West, I’d certainly vote for the former versus the latter. But local air quality regulations don’t always differentiate, and public outcry due to smoke emissions from recent treatments suggests that awareness of the magnitude of these trade-offs far from universal. All of this is complicated, as well, by the fact that the kind of stagnant air conditions that trap smoke particles near ground level will likely increase broadly across the Western U.S. as the climate warms—which would potentially increase health risks from smoke and particulate matter from all sources. But even in this case: smaller volumes of potentially less toxic smoke, under weather conditions largely of our choosing, are probably going to be preferable to increasingly severe and prolonged smoke-related air pollution events under the worst possible weather conditions.
Broad windows of opportunity (like this year in California) will still remain, and may expand into non-traditional seasons (especially winter)
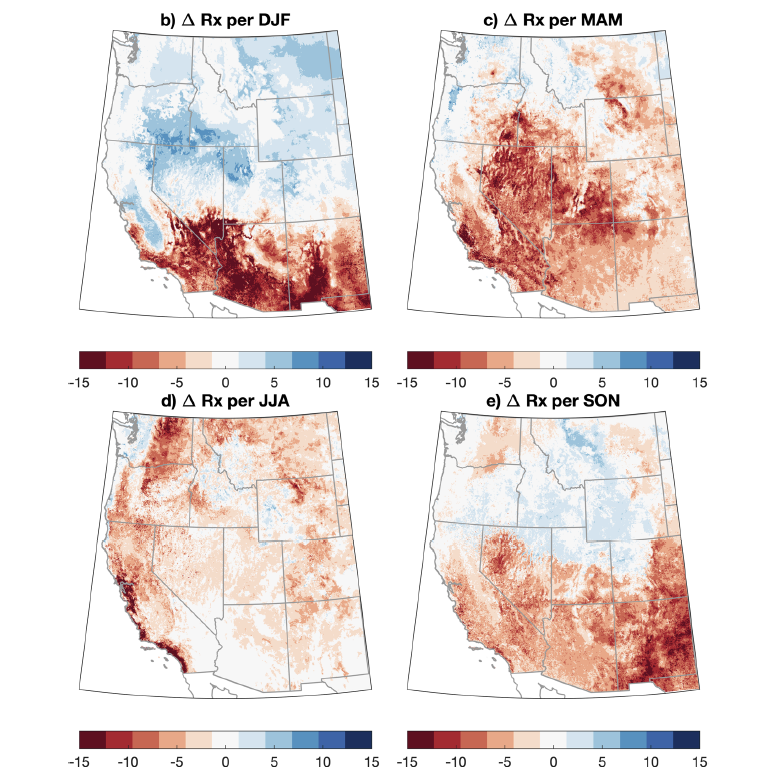
In this study, we also consider how projected changes in RxDays vary seasonally—and these seasonal trends paint a decidedly more complex picture than the annual trends alone might suggest. Climate change doesn’t just mean warmer temperatures; it also means changes in precipitation intensity & seasonality, relative humidity, wind patterns, and subsequently in vegetation moisture levels as well. These changes vary not only in space—which is already clear from the annual trend map above—but also in time, resulting in rather dramatic seasonal differences in the seasonal occurrence of RxDays across different parts of the U.S. West.
Generally, projected decreases in RxDays are most geographically widespread in summer and spring, affecting nearly the entire study from the Pacific Coast to the Rocky Mountain Front Range in these seasons. Of particular note are large decreases along the central and southern California coast (including the San Francisco Bay Area and much of the highly urbanized corridor of Southern California) during both spring and summer, as well as strong decreases across the entire Great Basin and Four Corners region in spring. Autumn RxDay losses are still widespread across the southern tier but are weaker or even absent (with modest local increases) during autumn across the Northern Rockies.
Projected winter trends, however, are quite strikingly different from those in other seasons. Here, decreases in RxDays are confined to the southernmost part of the domain (including southern California, far southern Nevada, and Arizona/New Mexico. Elsewhere, weak to moderate increases in RxDays emerge across much of the Great Basin, Northern Rockies, and interior portions of Oregon and Northern California. Remember: because of the “Goldilocks” nature of the RxDay definition (i.e., it can’t be either too wet or too dry), increasingly warm and dry conditions during certain seasons would tend to push already dry regions out of prescription parameters, but may actually push historically damp regions into prescription by drying out fuels that were simply too wet to burn efficiently in the past. This essentially accounts for the winter increases we see across the northern tier generally—a place that has been historically, as you might expect, pretty wet and cold in winter.
These findings strongly suggest that expanded windows of opportunity to use prescribed fire effectively and safely may well emerge at a time of year when such burns have, for the most part, been far less common across the West. One challenge? Winter is when nearly all seasonal wildland fire employees have already been let go for the year, so staffing is an even greater problem at this time of year than during the autumn and spring shoulder seasons. But ultimately, the study authors are relatively optimistic regarding this development—even as most places in the West see decreases in the environmental favorability for prescribed fire during most of the year, modest changes to existing land and fire management priorities (including the retention of more year-round employees) could make it possible to take advantage of these new potential winter burning windows.
A word of caution regarding risks from long-term drying of heavy (“1000-hour”) fuels
Prescribed fire has a long track record of a offering safe and effective way of managing the risks of catastrophic wildfires, as well as improving ecosystem resilience. The rate of prescribed fires that escape primary control lines is quite low (under 1%), and the further subset of such events that go on to cause significant damage is even smaller. But even though the risk profile associated with such burns is, almost always, much lower than that of their uncontrolled wildfire counterparts—it’s not zero, and the consequences can sometimes be serious. A particularly dramatic recent example of this is the Calf Canyon/Hermits Peak wildfire in 2022, which was ignited when two separate nearby prescribed fires or burn piles on federal forest land escaped under adverse weather conditions and later merged—becoming New Mexico’s largest and most destructive fire in state history. The fallout from this event even resulted in a temporary ban of all prescribed fires on federal forest lands (which has since been lifted).
Subsequent analysis highlighted the critical role of exceptional drought conditions and record warm temperatures in facilitating this atypically disastrous outcome, and in particular the extraordinary/record-breaking dryness of “1000-hour fuels” (essentially, dead/downed trees that can create “jackpots” of explosively dry fuel under the right conditions). This is, perhaps unsurprisingly, a key factor in the intensity of many recent extremely intense forest fires across different parts of the American and Canadian West, where decades of heavy fuel accumulation (though forest management policies, insect infestations and subsequent tree mortality, and other factors) have created a situation where climate change has “kiln dried” both standing dead trees (snags) and extensive amounts of woody debris on the forest floor (ranging in diameter from small branches to entire tree trunks).
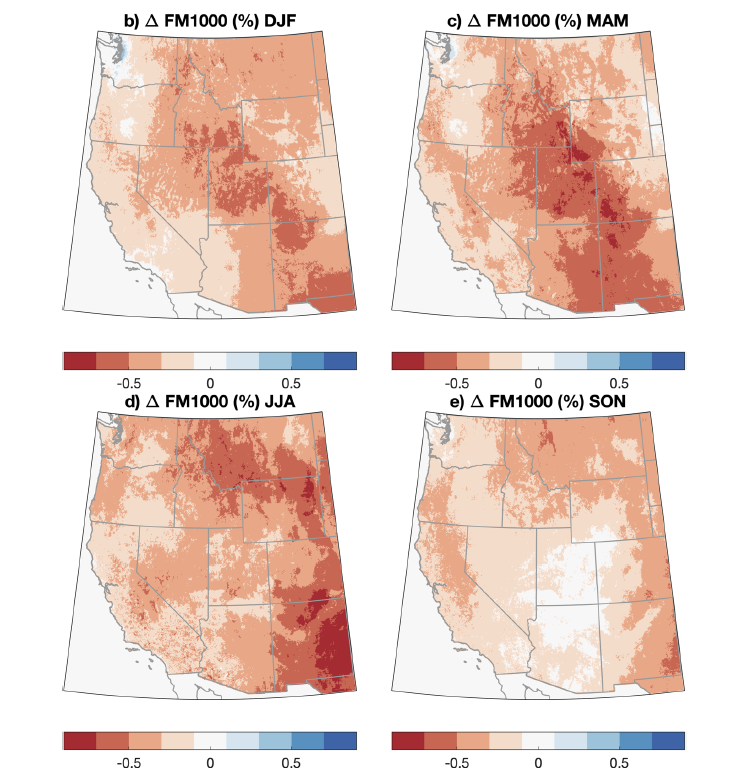
In this study, we quantify projected changes in the moisture contained in these “heavy fuels” that seem to be a common risk factor in both (rare) prescribed fire escapes and (unfortunately now common) high severity wildfires in forests. We project substantial decreases in 1000-hr fuel moisture (i.e., increases in dryness) essentially everywhere across the American West and in all seasons due to climate warming, though the magnitude of the increases is generally greatest in spring and summer and least in autumn. Notably, the region of the 2022 Hermits Peak Fire (in Northern New Mexico) is close to the epicenter of some of the largest projected decreases in FM1000 during spring and summer.
So…how about this (unusually damp) year in California?
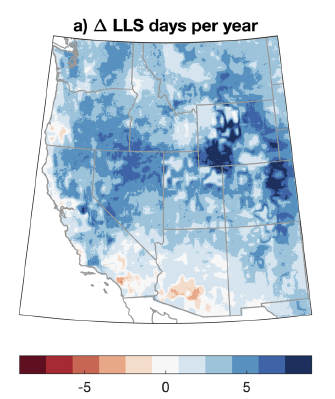
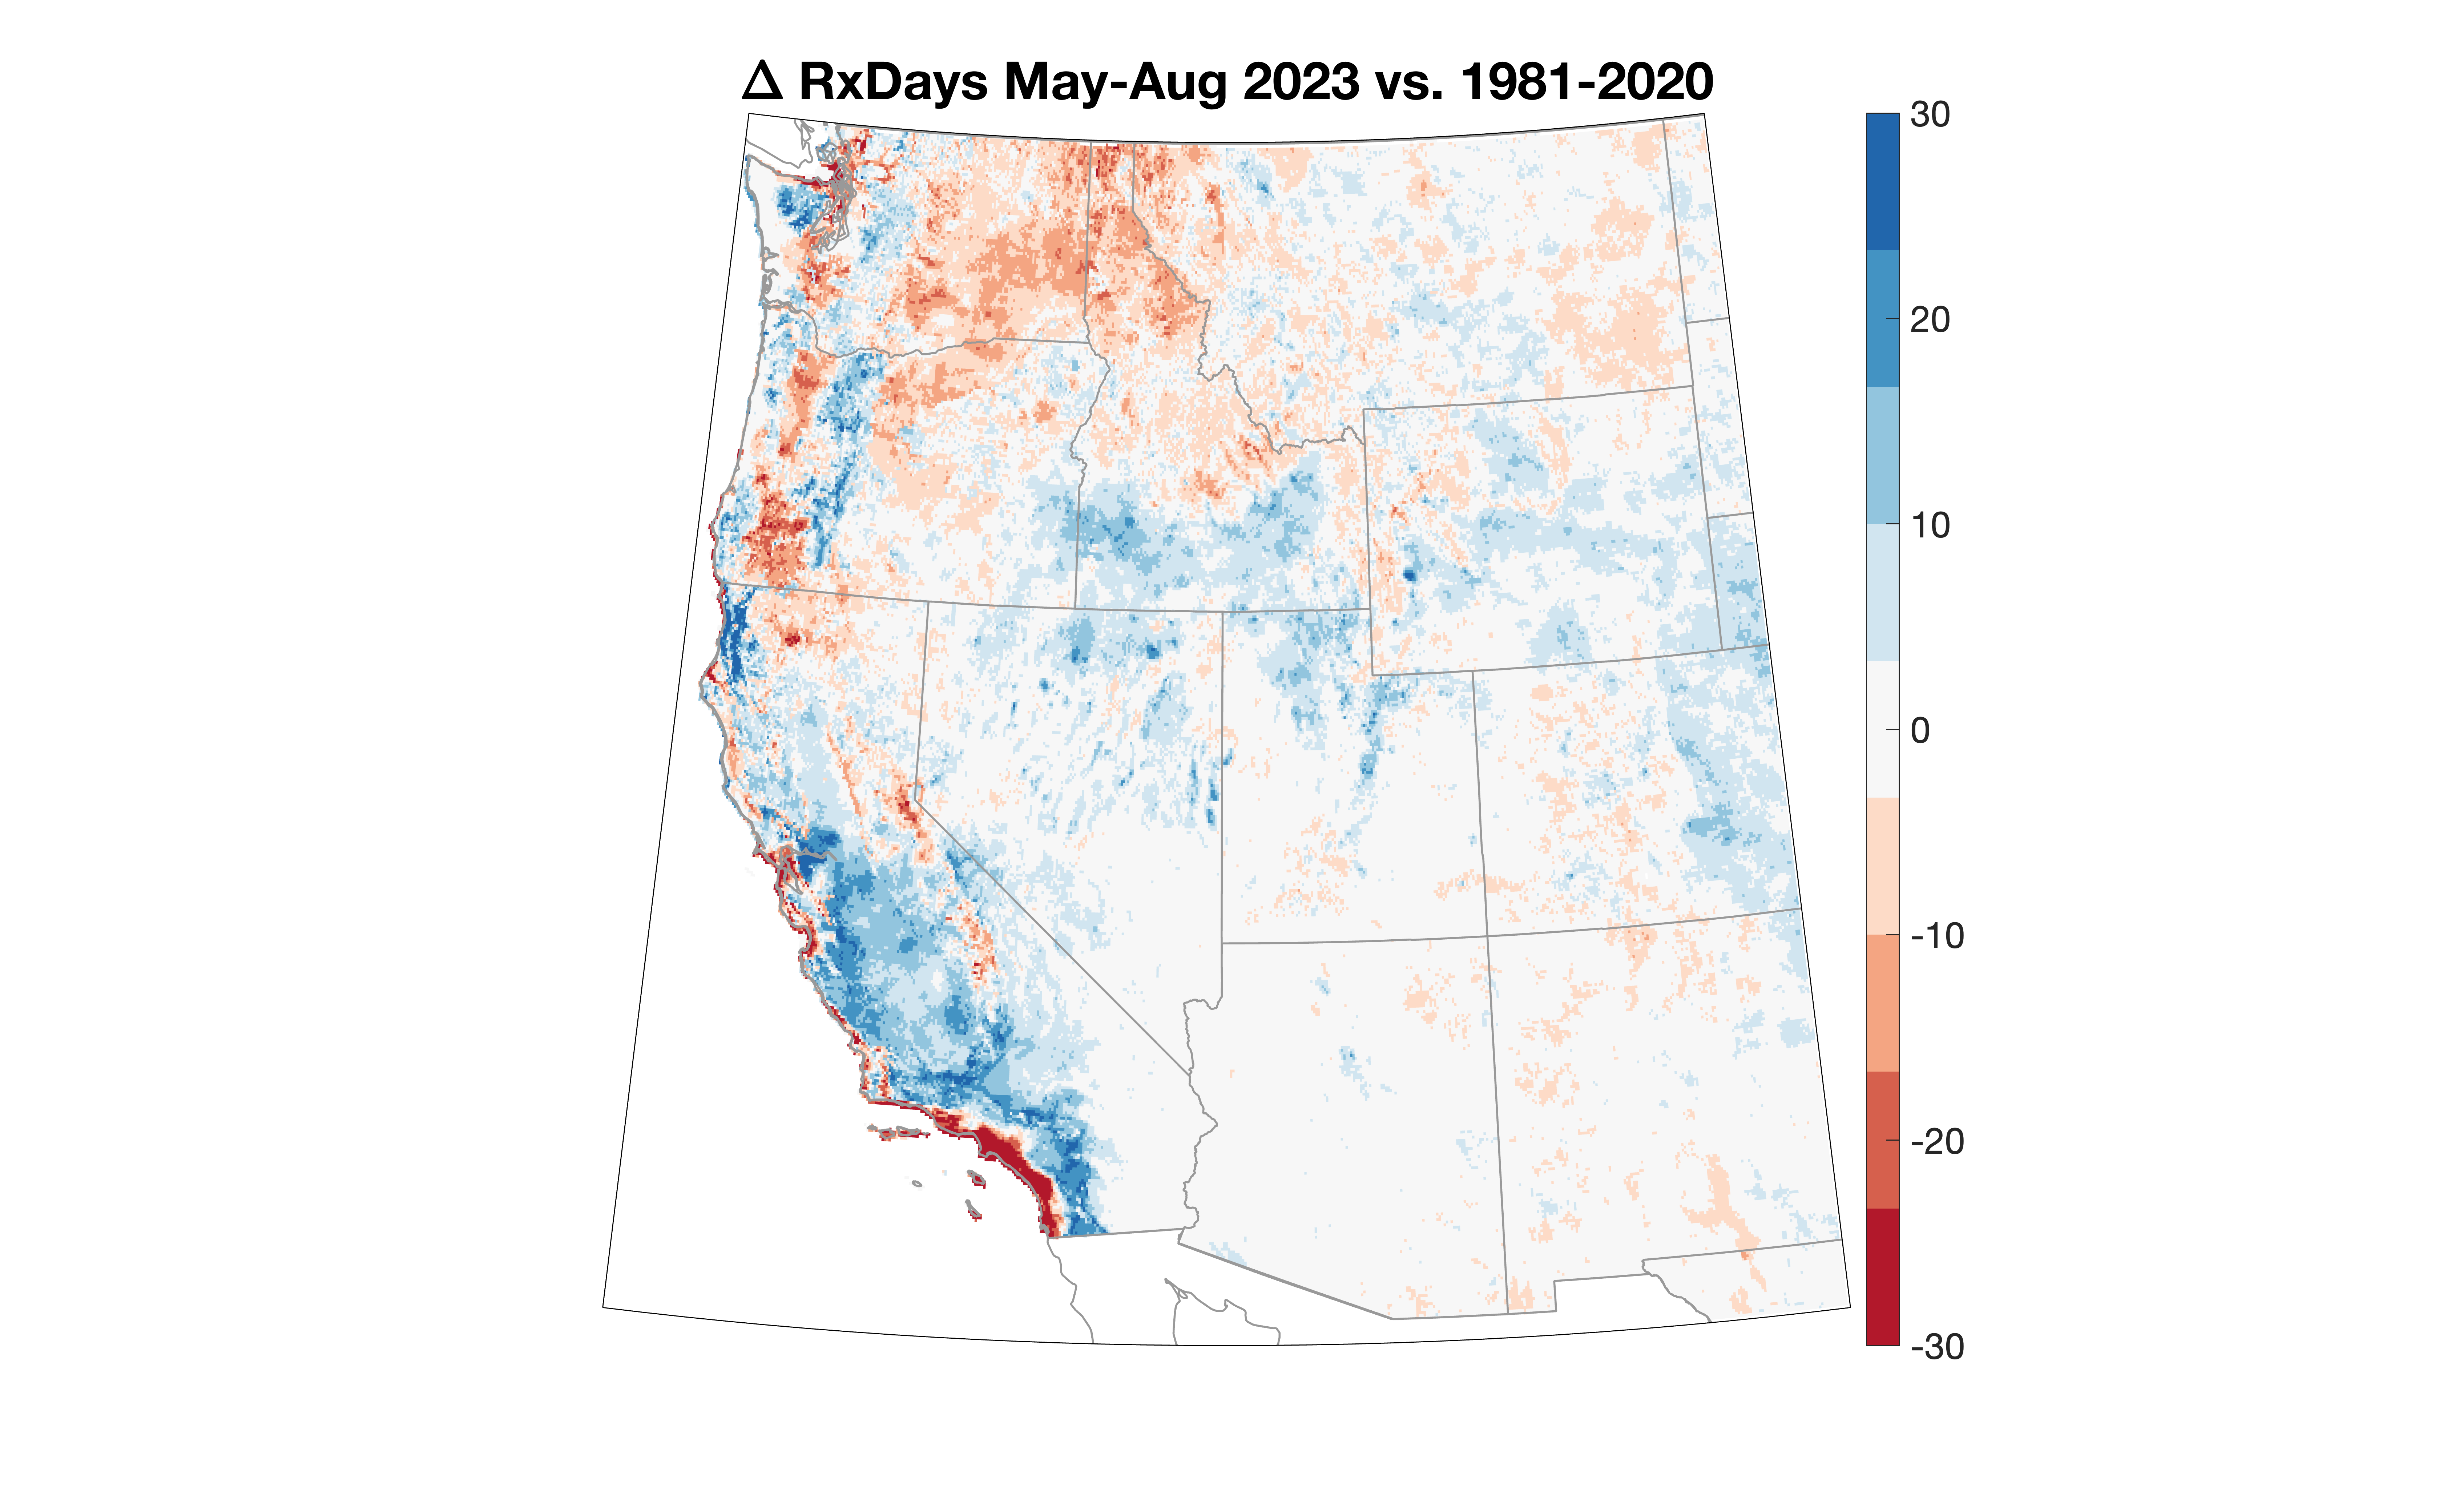
One question that we, the author team, had been asking in the final months of preparing this study for publication: How would the unusually wet and cool (at least by the standard of recent decades!) winter, spring, and summer 2023 affect prospects for prescribed fire treatments this year in California? Would such opportunities be increased relative to the recent baseline, which has included a number of exceptionally hot and dry years? Well, using the same framework and definitions developed for our study, co-author John Abatzoglou offers an answer via the figure below.
Lo and behold, there are a lot of blue colors on the map across much of California—demonstrating that this year’s cooler and wetter conditions in California have indeed yielded substantially more potential RxDays that have been typical in recent decades. Moreover: in some parts of California where this was not the case (especially across the highest elevations of the Sierra Nevada), that’s likely because conditions remained too damp through the summer for acceptable burning conditions! Meanwhile, across much of the Pacific Northwest and northern interior (where severe drought and significant wildfire activity has occurred this year), the number of RxDays through August 2023 was substantially decreased relative to the historical baseline.
While 2023 represents only a single data point, it’s nonetheless illustrative of the fact that even places projected to see large decreases in the overall number of days favorable for prescribed fire amid a warming climate will still see seasons and years where extensive opportunities arise (as in California this year). Ultimately, this work highlights the growing importance of moving toward temporally and geographically flexible wildland and prescribed fire (co-)management policies that allow us to take advantage of those windows to put good fire on the ground in the American West—where and when they do arise.
How is this article different from typical Weather West blog posts?
This special Weather West article focuses on peer-reviewed scientific research that my colleagues and I recently published in Communications Earth and Environment. This means that the content of this piece is based upon findings from formal scientific investigations by a team of researchers, which contrasts with more typical Weather West posts that are primarily based upon my own informal thoughts and analysis. I would like to thank my co-authors in this work—John Abatzoglou , Crystal Kolden, Kristen Shive, Dmitri Kalashnikov, Deepti Singh, and Edward Smith—for their sustained efforts in bringing this project to completion over multiple years! Support for my contribution to this research was provided through a partnership between UCLA’s Institute of the Environment and Sustainability and The Nature Conservancy of California as well as the National Science Foundation.
A fully open-access version of this paper (freely accessible to all!) can be viewed here (Swain et al. 2023).