Across Southwest, a mid-late summer characterized by exceptional and sustained overnight warmth
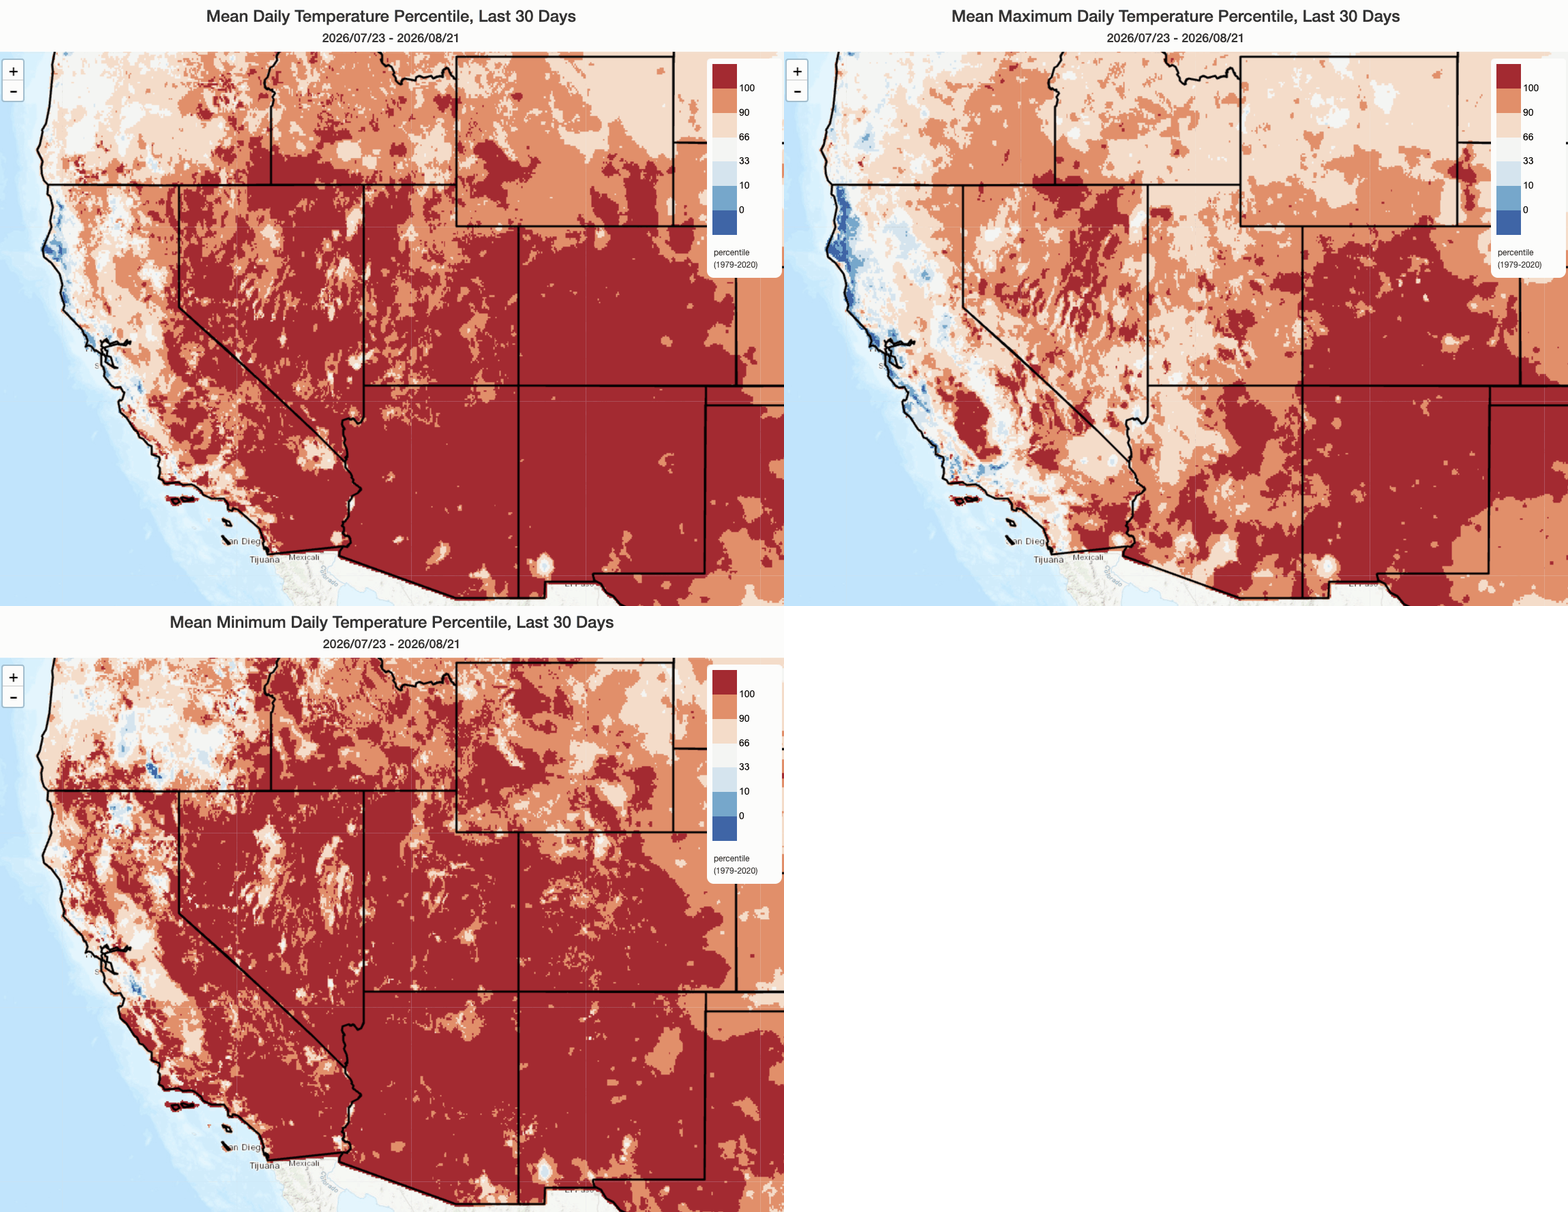
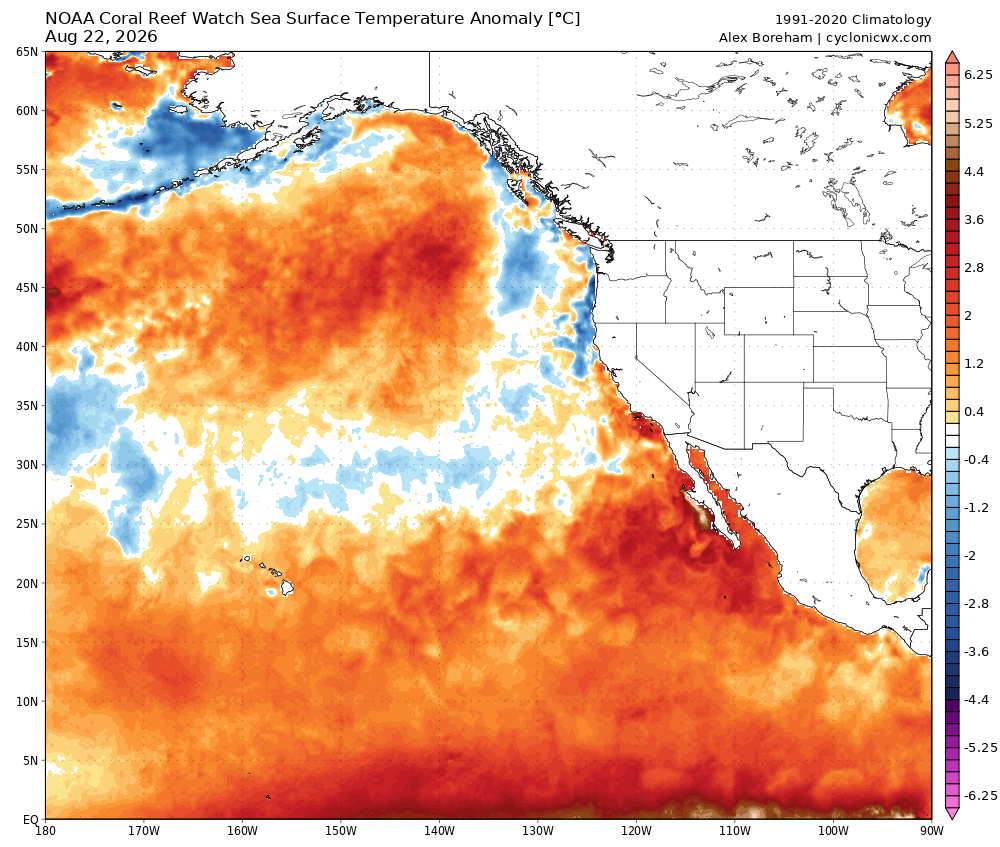
Following a record warm winter across most of the American West, it has also been a record (or near-record) warm summer across most of the interior West (and fire season from the Southern Rockies to the Great Basin to the Pacific Northwest has responded accordingly). In California, however, conditions have generally been milder. This was especially true earlier in the summer; in recent weeks, ocean temperatures have begun to rise farther north along the coast, and more significant inland heatwaves have also occurred. Meanwhile, in coastal SoCal, temperatures have been warmer than average day and night–mainly thanks to near-record water temperatures for much of the summer.
Over the past 30 days, anomalous warmth has spread further west into California, and some of California’s more inland and southern regions have actually been record, or near-record, warm during this period. Yet many folks have noted that it doesn’t feel all that hot–so how could these statistics possibly pencil out?
Well, a big part of the reason why folks have perceived what has actually been one of the warmest Jul-Aug periods on record in inland and southern CA to be something other than that is because the most anomalous warmth has actually occurred at night–in the form of elevated overnight minimum temperatures–as opposed to during the daytime. In other words: While daytime temperatures have been near, or slightly above, average in some parts of California, overnight temperatures have been very far above average across nearly all of the state. (The animation above is demonstrates this pretty clearly, as it shows the relative rank of mean, daytime maximum, and overnight minimum temperatures for the past 30 days.)
Your mileage may vary, of course, depending on where you are. In Colorado and New Mexico, it has been essentially record warm day and night. But the closer one goes to the Pacific coast, the most notable warm is mainly occurring at night. Some of this comes from the very warm water along and off of the coast of California and Mexico; farther inland, the record-breaking day and night warmth instead derives from persistent mid-atmospheric ridging and ongoing land surface feedbacks from severe to extreme drought across the Colorado Basin. And this is a pattern I would generally expect to continue into the autumn across California, and perhaps elsewhere, though perhaps with more warming of the far North Coast by Sep-Oct as El Niño strengthens.
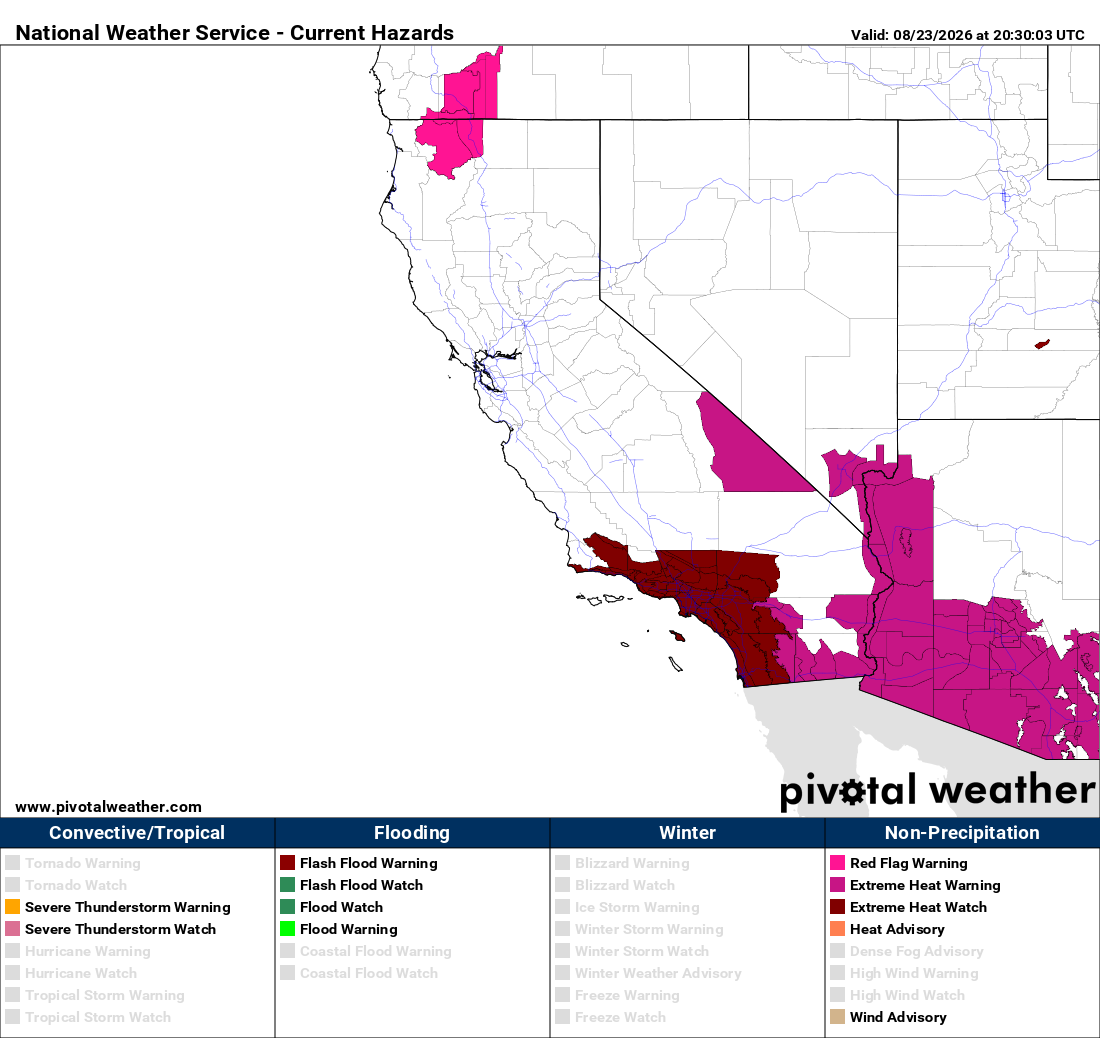
Major, and perhaps locally extreme, SoCal heatwave this week with lingering uncertainty re: offshore flow
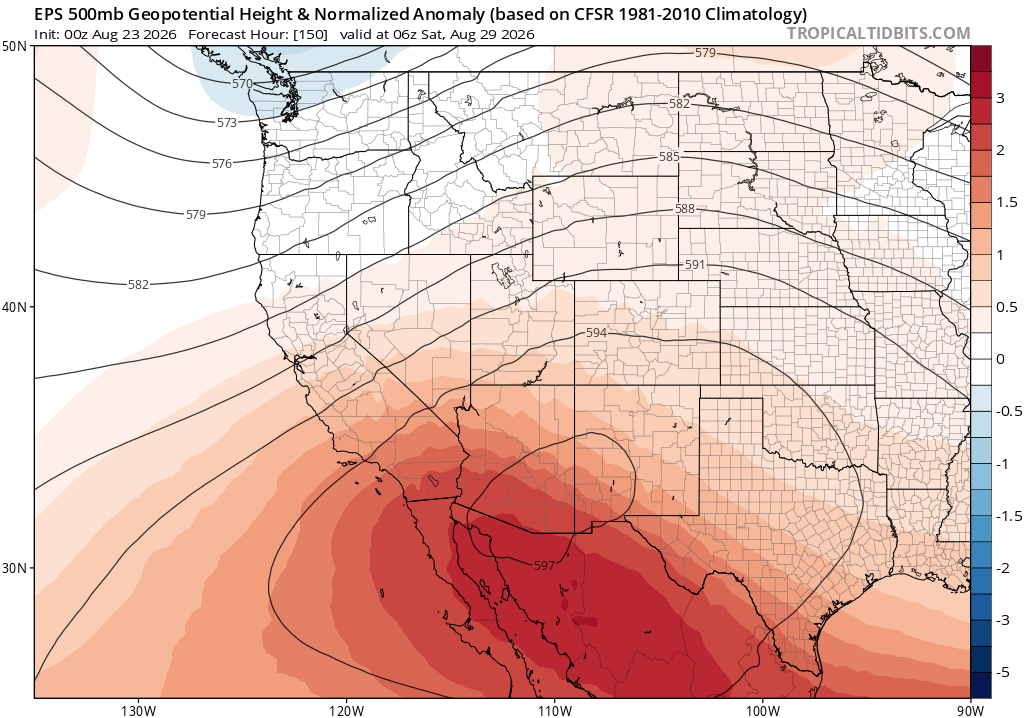
It’s going to be a hot week across southern California and southern Arizona, that much is certain. (And it won’t get that hot in NorCal; that much is also pretty clear). But there is also the potential for some genuinely extreme heat in some areas, depending on exactly how the pattern develops.
A very strong late-summer ridge will build over northern Mexico and southern Arizona, the most anomalous lobe of which will extend westward directly over southern California. This ridge will be near-record breaking for late August, so the overall lower half of the atmosphere will be remarkably warm (even by climate-warmed August standards). This will bring very hot temperatures not only to the usual desert regions, but also to the SoCal inland valleys and–on at least a couple of days this week–probably quite close to the coast itself. It’s possible there could be a very narrow strip just a couple miles wide where a cooler marine influence prevails, but even here it will be warm. And it’ll likely be very narrow indeed–downtown LA will be well into the 90s, and perhaps into the 100s, on multiple days this week; the SFV and IE will be quite a bit hotter than that.
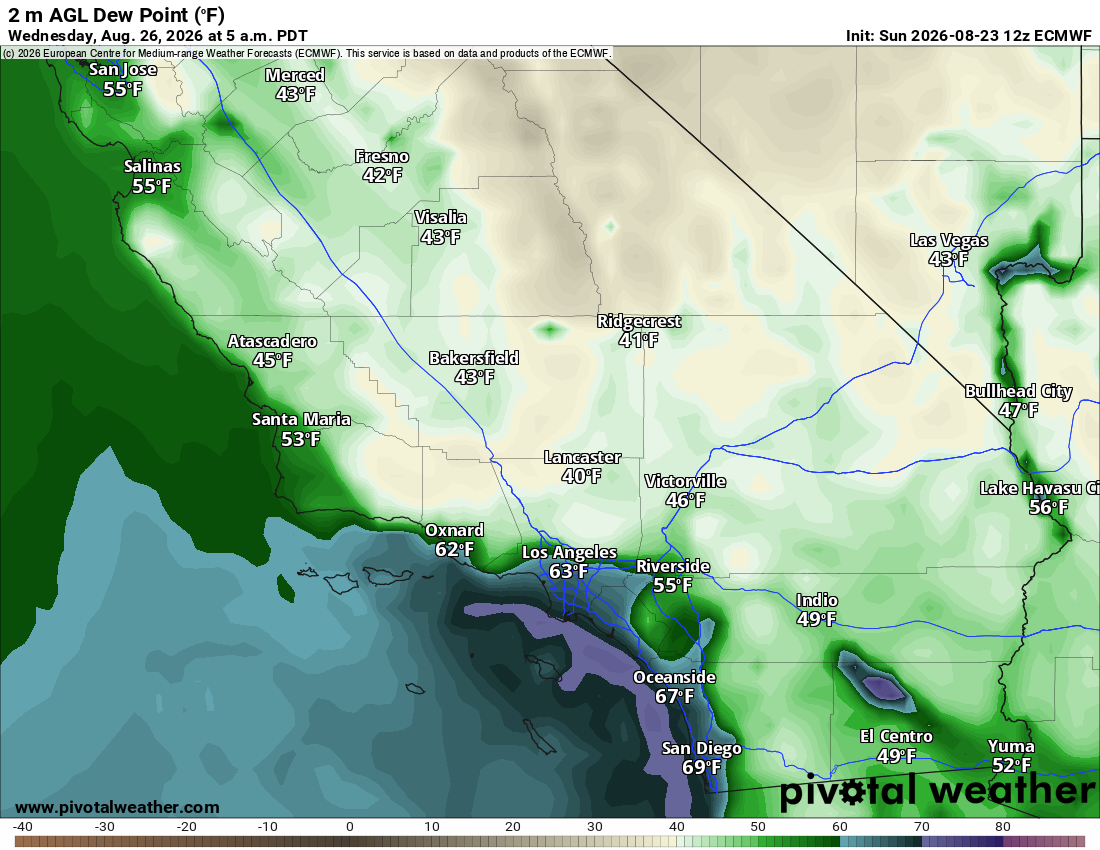
In addition: Greatly elevated coastal humidity persists, as it has for almost the entire summer, from about Santa Barbara southward along the SoCal coast thanks to unusually warmer nearby ocean waters. This week’s heatwave won’t feature a particularly notable monsoonal moisture surge, at least in the lower levels, but a shallow layer of very humid air will remain over the water and along the immediate coast, occasionally spilling inland (especially at night). This could lead to elevated heatwave impacts from a human health perspective as moisture increases head index values/apparent temperatures, and also helps keep overnight temperatures greatly elevated. The greatest humid heat risk might actually exist in a somewhat narrow strip a few miles inland from the coast where significant humidity converges with high heat from inland areas (along the coast, it will be much more humid but cooler; inland, much hotter but also less humid). This “battleground” between heat and humidity will likely be dynamic, and move around day to day and even diurnally.
And also: There is actually at least a 30-40% that this heat event ends up being quite a bit more extreme in SoCal than is currently indicated in most forecasts. The ECMWF and its ensemble, in particular, are suggesting that some weak-moderate offshore flow could develop during the Wed-Fri period. If that happens, additional warming could occur due to downslope warming across inland valleys (perhaps to near or above 110F) and near-100F weather could extend all the way to the beaches. If such a pattern develops, there might also be the potential for strong “sundowner” downslope winds along the coast below the Transverse Ranges; together, this would increase potential for both heat-related health impacts and also wildfire risk. While the odds of this happening are uncertain, it’s worth watching closely as it would greatly increase the potential for record-breaking heat and possibly critical fire weather conditions in some areas. I’ll be following this week, and will update on social media if the odds of this outcome start to increase.
Currently modest, but growing, odds of some kind of “tropical remnant” event in California heading into September
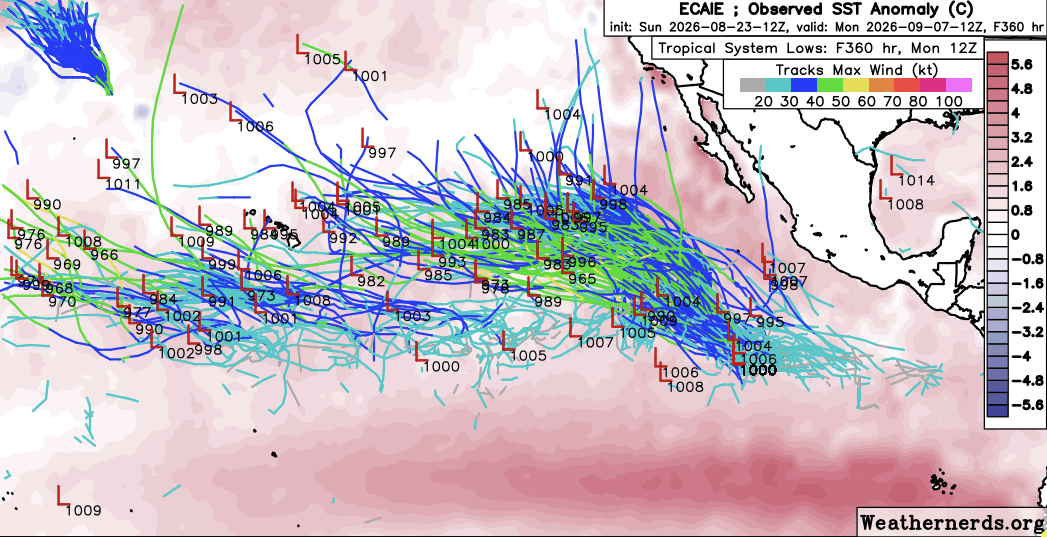
We’re entering peak season for re-curving northeastern Pacific tropical storms and hurricanes to potentially affect California with their remnant moisture and circulation. And, as I’ve previously discussed, the odds this year will be above average due to the combination of unusually warm ocean water between SoCal and the hurricane development region west of Mexico, and also due to the decrease in storm-destroying wind shear in the same region due to El Niño and other factors. And the East Pacific sure is heating up, figuratively but also literally: following Hurricane Lala’s severe flood and debris flow-inducing near-landfall on the Big island of Hawaii, additional tropical storms and hurricanes are expected to develop between Hawaii and California over the next two weeks. Most will likely move harmlessly northwestward, giving Hawaii a relative break and staying far away from California. But in recent days, a growing number of ensemble members (across models) have shown somewhere between a 5 and 20% chance of a weakening tropical storm or depression making a northward turn directly toward California in early September. The odds are still low, but this does bear watching in the coming days as this is the exact time of year when it might be most likely to occur in this El Niño-boosted season. And there will likely be other opportunities later in September, and possibly into October as well. I’ll be following closely!
Recent research and my accompanying commentary: Emerging evidence of increasing Western U.S. “snowpack whiplash” amid clear signs of climate change role in record-breaking 2026 West-wide “snow drought”
I wanted to take a moment to share my recent published commentary on research originally published in the Proceedings of the National Academy of Sciences (PNAS) last month. The original paper by Marshall et al. focused on rapid attribution of the severe and in many cases record-breaking 2026 Western U.S. snow drought, which was associated with record-shattering winter/spring warmth especially during Feb-Mar–finding that historical warming made the 2026 event around 4 times more likely to have occurred with the extremity that it did on a West-wide basis (and ~14 times more likely in the critical Upper Colorado watershed, specifically). One truly remarkable statistic? The “missing volume” of 2026 snowpack water volume specifically attributable to historical climate change was 40 cubic kilometers–larger than the entire storage volume of Lake Mead. (And that isn’t even the full climate change effect–that only represents the effect on winter 2026 snowpack specifically, and not other major factors like longer-term increases in evaporative water loss during other seasons).
In my commentary reflecting on this notable analysis, I offered a couple of cursory additional analyses to address an anecdote that has been circulating recently: That the variability, or “whiplash” of Western snowpack seems to have increased in recent decades, and that the relatively modest (though still notable) declines in mean snowpack “feel” smaller than the perceived trends. So, is there any truth to this?
Well, with the caveat that this is not a comprehensive analysis, the initial answer appears to be a resounding “yes.” While West-wide snowpack has decreased, on average, by ~25% since the 1980s (and in some specific basins more, or less, than that average), the overall year-to-year variability of Western snowpack has increased by 44% during the same period–and the intensity of year-to-year differences has increased by over 80%! And this helps answer the question of “Why does it feel like snowpack has decreased by more than 25%?”, because nearly all of the increased variability comes from a very large increase in extremely low snow years and no decrease at all in extremely high snow years! So, in other words: When it comes to Western U.S. snowpack, the bottom has fallen out, but the ceiling remains intact.
Whether that increase in variability is, itself, attrutable to human-caused warming (I suspect it is, but demonstrating that would require a deeper analysis) is an important question, since it suggests we may need to be preparing for low snow years that emerge far faster than mean trends would suggest on their own. But it also suggests that heavy snow seasons are still occurring, especially at the highest elevations, and this has implications for everything from ecosystem viability to transportation planning to ski resort revenues. If you’re interested in digging a bit deeper, including consideration of potential competing thermodynamic drivers, check out either the commentary itself or the social media thread below:
Quick El Niño update: It’s already strong, getting stronger, and will likely have major CA impacts fall-winter 2026-2027
El Niño will be a growing focus of my weather and climate communication activities in the coming weeks and months (RIP my inbox). But last week, I did create a El Niño factsheet aimed at addressing commonly answered questions that are swirling regarding this year’s event specifically. I would strongly encourage folks to check it out via the link below–and/or also to download and share the sheet itself (see PDF and JPEG versions). But the TL;DL version is:
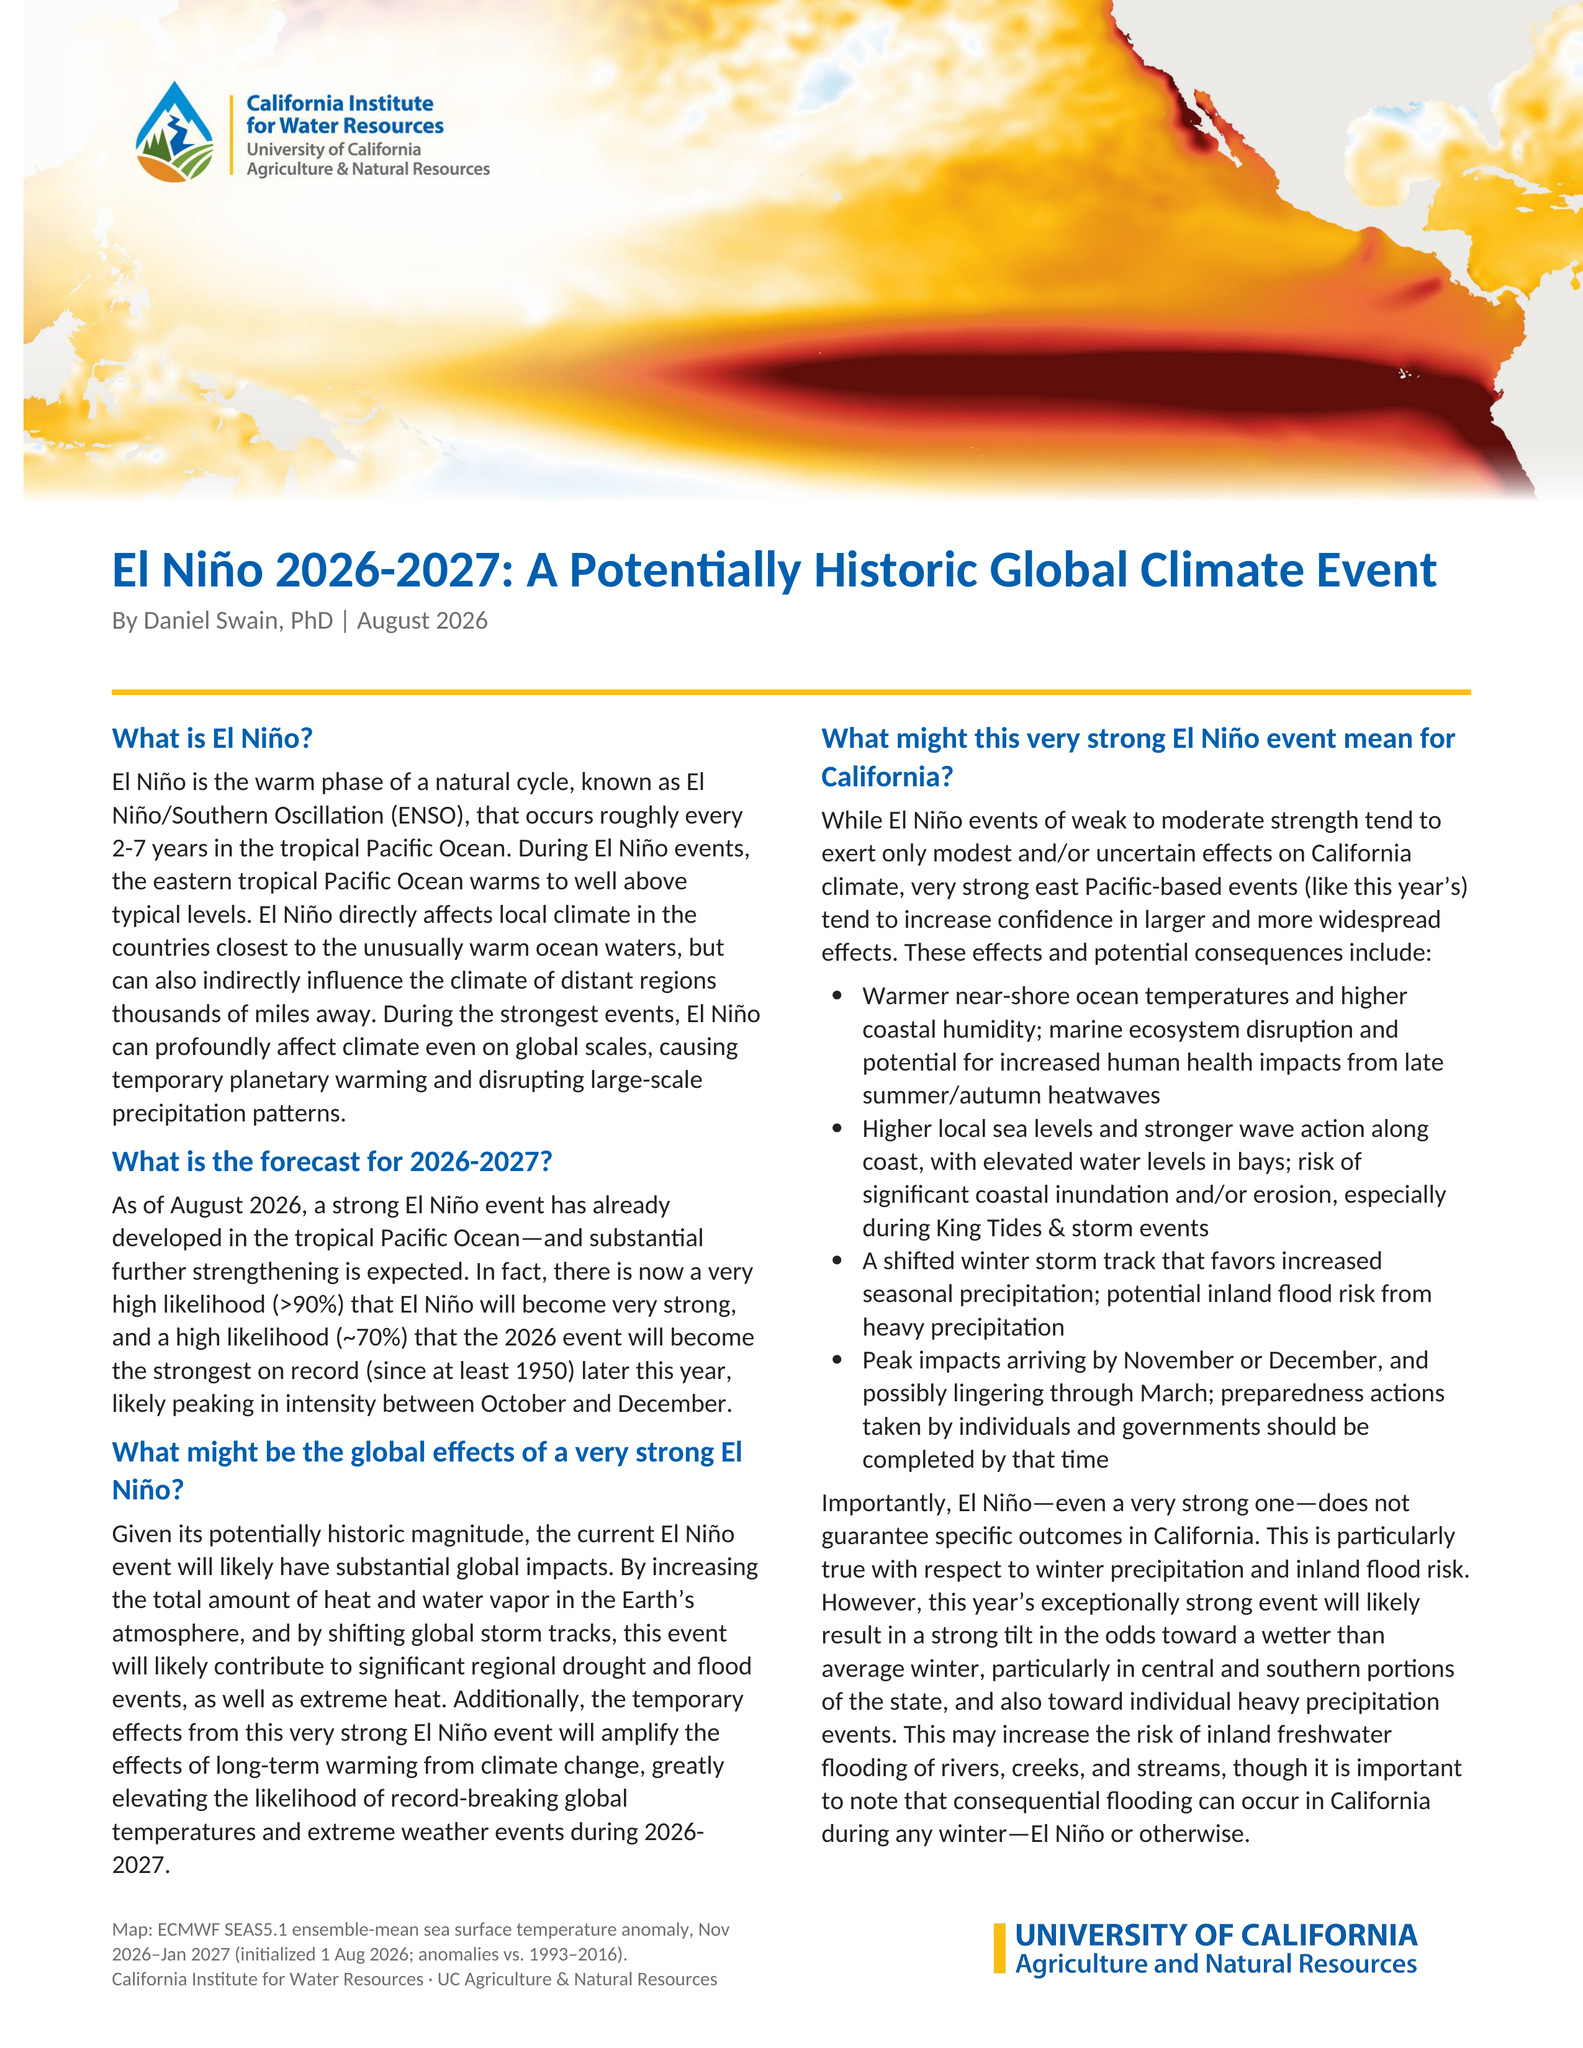
- El Niño has already developed, and is rapidly strengthing
- El Niño will peak in intensity sometime between Oct and Dec somewhere between very strong and (most likely) historic strength
- Widespread, and likely large, global temperature and hydroclimate impacts likely; 2027 will almost certainly be hottest year on record globally
- In California, main effects will likely not emerge until November, and possibly not until December (esp. precipitation-related)
- High confidence in temporary sea level elevation and increase in ocean wave activity; risk of severe, widespread, and prolonged coastal flooding (esp. during King Tides and storm events)
- A wetter than average winter is the most likely outcome across most or all of CA; there is also rising potential for a very wet winter, including elevated risk of individual extreme precipitation events, and potential for flooding of rivers, streams, and creeks
YouTube livestream at Noon Pacific Time on Mon, Aug 24: Update on Major SoCal heatwave potential this week
Join me live for a live “lunch hour” discussion of the upcoming SoCal heatwave. Come with your questions!
Discover more from Weather West
Subscribe to get the latest posts sent to your email.