Extreme atmospheric wave pattern returns to North America
A rather extraordinary sequence of atmospheric events has unfolded over the Pacific Ocean and across adjacent North America over the past week or so.
The current pattern is strongly reminiscent of the extremely high amplitude wave pattern that dominated most of winter 2013-2014 and the latter half of 2012-2013. While the implications are a little different for California this time around–since the subtropical jet has thus far been a bit stronger, and allowed some occasional precipitation to affect the northern part of the state–in a large-scale sense the setup is remarkably similar to that which has occurred repeatedly in recent years. The “Warm West/Cool East” pattern, which is characterized by a persistent and well-defined pressure dipole (high pressure in the West and low pressure over the Midwest/Eastern Seaboard), results in unusually dry and warm conditions in California (while bringing impressive cold and snow to areas from the Rocky Mountains eastward).
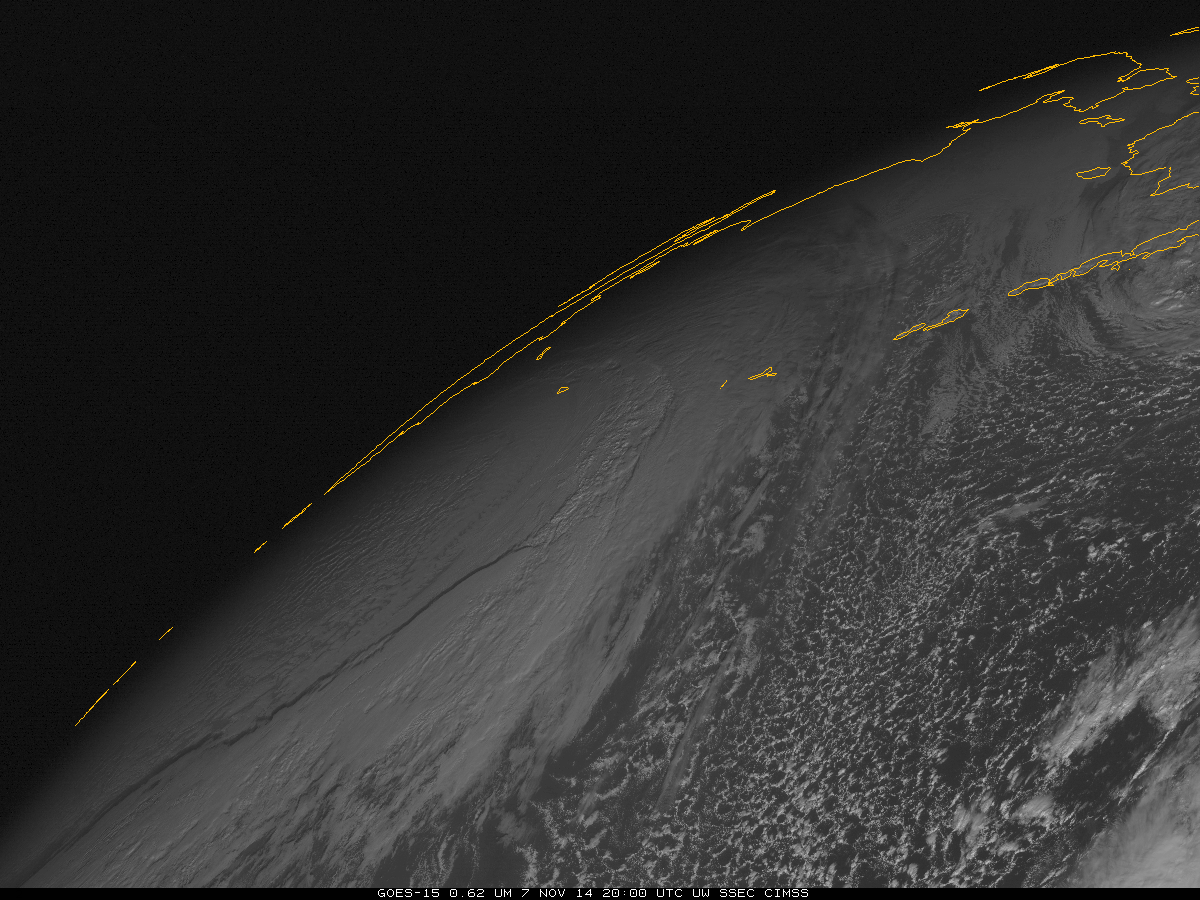
This time around, there’s a fairly obvious culprit for this recent pattern amplification: the remnants of former West Pacific Supertyphoon Nuri. Nuri’s remnants underwent a rapid deepening process known as “bombogenesis” as it traversed the North Pacific earlier this week, ultimately becoming perhaps the strongest extratropical cyclone ever recorded in the North Pacific basin (and bringing surface winds of ~100 mph to the outer Aleutian Islands, in addition to 50+ foot ocean waves).
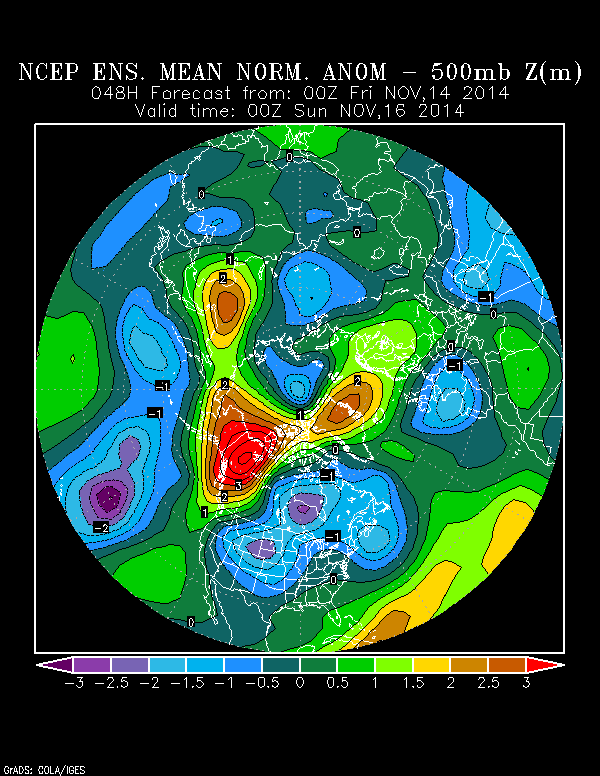
Poleward flow ahead of this powerful storm system pumped up a massive ridge along the West Coast, which extended all the way up into Alaska and even into parts of the high Arctic. This huge region of atmospheric high pressure has been centered further north than last year’s Ridiculously Resilient Ridge, which means that it (fortunately) presents a less formidable barrier to the Pacific storm track. Still, this ridge has been strong enough to substantially weaken what had initially appeared to be a series of much-needed moist storm systems for California, which have ultimately brought only limited light precipitation to parts of the state. The subtropical jet stream appears to be having a hard time undercutting a ridge of this magnitude, which appears poised to stick around for at least a few more days. While Nuri’s influence is now waning, blocking ridges are typically sustained in part by self-reinforcing feedbacks, and it’s likely that the unusually warm and stable airmass over Alaska and the West Coast (and, subsequently, the extremely cold Arctic airmass over the rest of the United States) will take a while to break down.
Drought update: It’s still getting worse
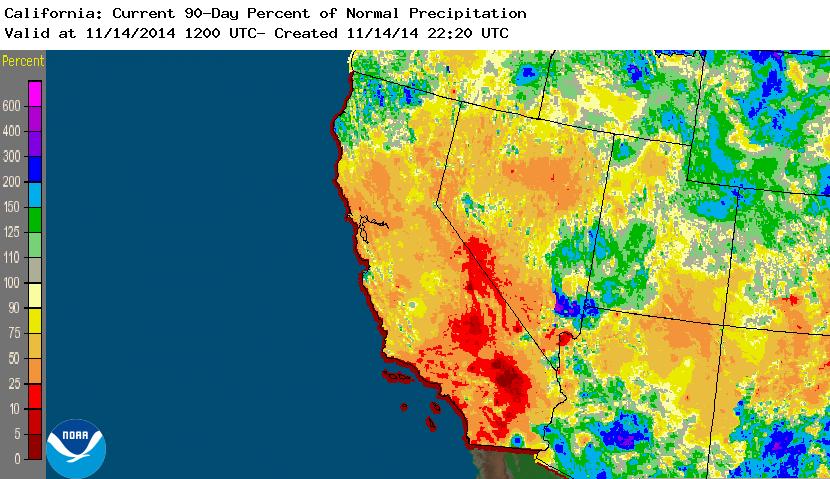
While it’s true that this autumn has not been quite as dry as last year’s on a statewide basis (and, indeed, the far North Coast has even seen some locally above-average precipitation), most of the state has actually seen considerably less precipitation since early September than during a typical year. These relatively modest precipitation deficits add to the truly enormous ones that have accumulated over the past three years. In fact, the last 36 months now comprise the driest 3-year period since at least the 1890s in California.
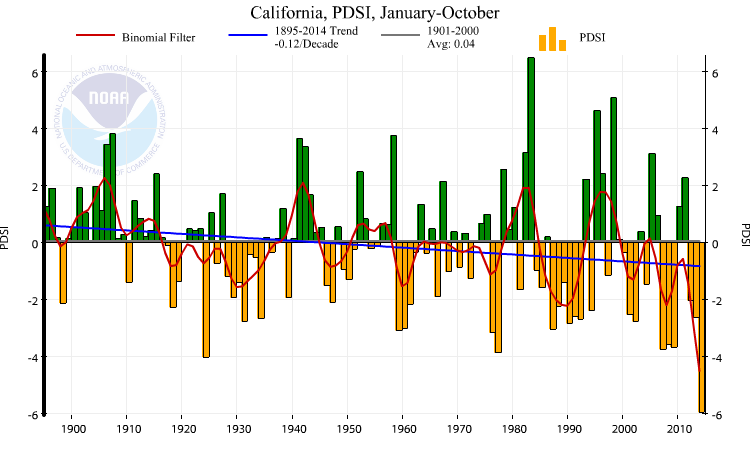
In addition to these extremely low multi-year precipitation totals, California continues to experience its warmest year on record by a tremendous margin–shattering all previous values since at least the 1890s and almost certainly much longer than that. This combination of very low precipitation and record-high temperatures has caused various formal drought indices to crash in recent months. The year-to-date Palmer Drought Severity Index, for example, is presently far lower than any previously recorded value for California–including those associated with the major early 1990s, mid-1970s, and mid-1930s droughts.
Short-term update: At least some light rain soon
The extremely amplified atmospheric pattern currently occurring (partly as a result of the influence of former supertyphoon Nuri) has led to wildly varying numerical model forecasts in recent days. As recently as this past weekend, it appeared that California might finally be in line for some widespread, significant precipitation as the subtropical jet undercut the huge high-latitude ridge over the West Coast and Alaska. Since then, however, the models have greatly backed off on projected rain amounts, instead suggesting that the huge ridge will be strong enough to split and/or deflect the moist storms that would otherwise be arriving from the Central Pacific. This sort of evolution is reminiscent of what happened during the early months of the last rainy season, when the numerical models struggled to cope the massive magnitude of the anomalous ridge over the far northeastern Pacific.
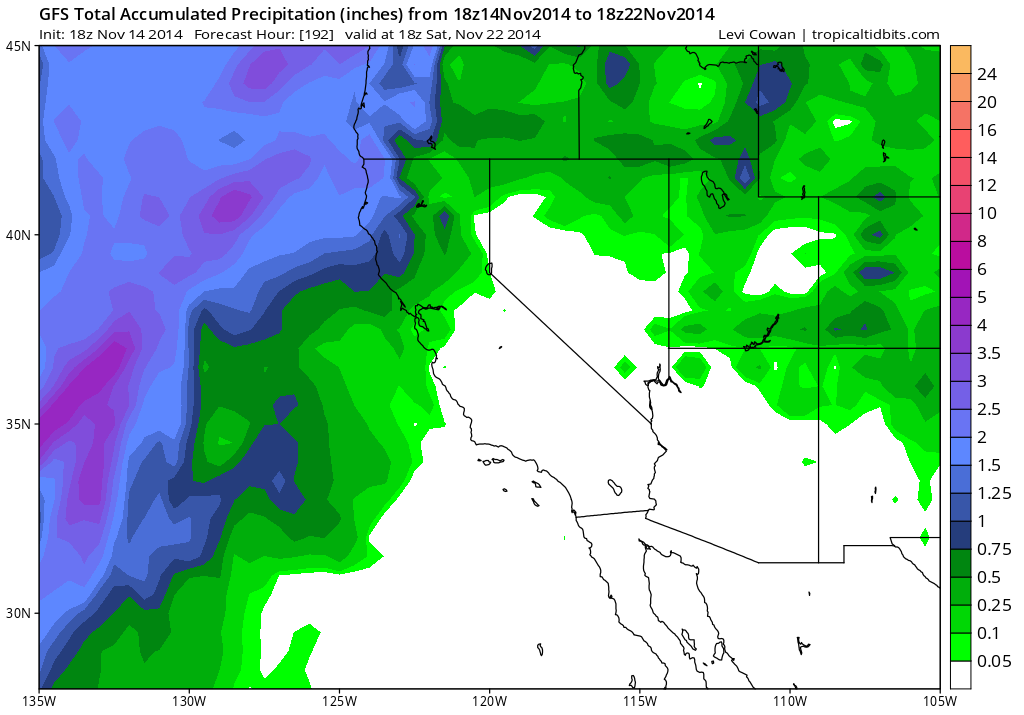
In the medium term, things still look fairly dry for California considering that we’re heading into the second half of November. There will probably be some rain at times, especially in the north, but there is still no real sign of major storm activity of the sort that would be highly beneficial from a drought mitigation perspective. There is presently some model disagreement, and obviously the forecast is subject to change considerably given the recently observed volatility stemming from the highly-amplified pattern. As has consistently been the case over the past 2 months, it appears that the far North Coast will see additional soaking rains over the next 7-10 days while the rest of the state sees relatively little precipitation (and nothing at all in the south).
Update on seasonal projections: Still murky
Well, long-term precipitation projections for California’s winter precipitation this year remain as clear as mud. The NMME–whose ensemble members just last month were nearly unanimous in showing drier than usual conditions in DJF 2014-5–now depicts a wetter-than-usual winter season.
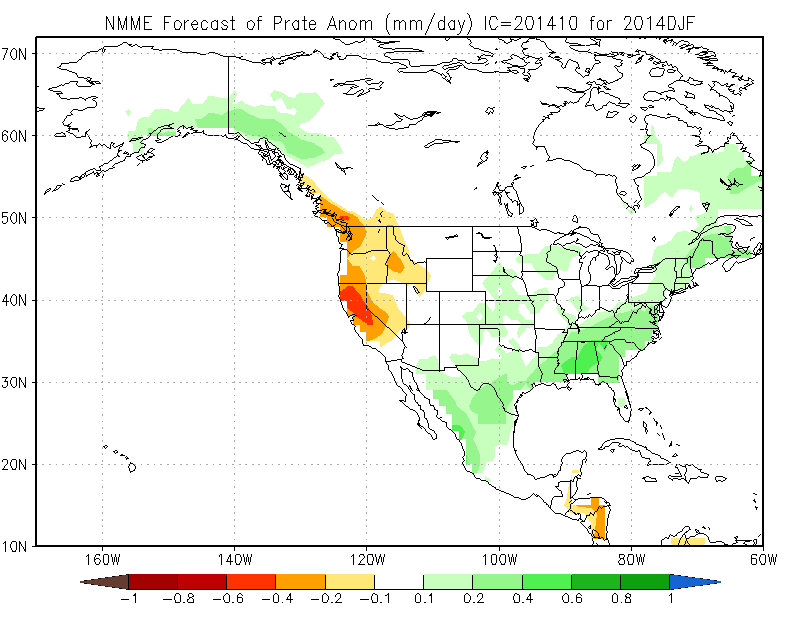
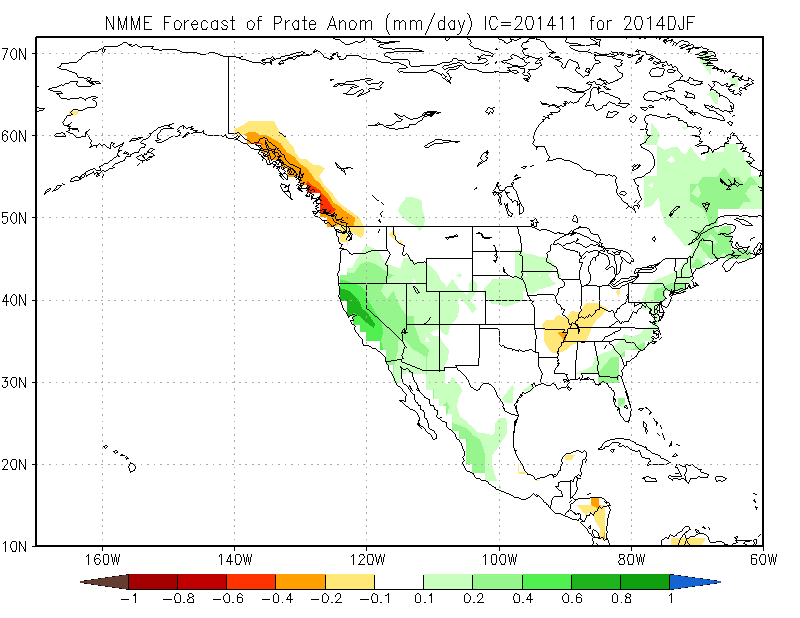
Since this new projection represents a complete reversal from the October runs, it would probably be unwise to read too much into this. What remains clear is that seasonal forecasts such as these–especially for precipitation in mid-latitude regions–can be pretty volatile, and remain subject to very substantial initial condition uncertainty. Also, it’s worth pointing out that at least one of the dry October or wet November forecasts must be wrong–and in the case of a near-average winter–It’s possible that both of them could be!
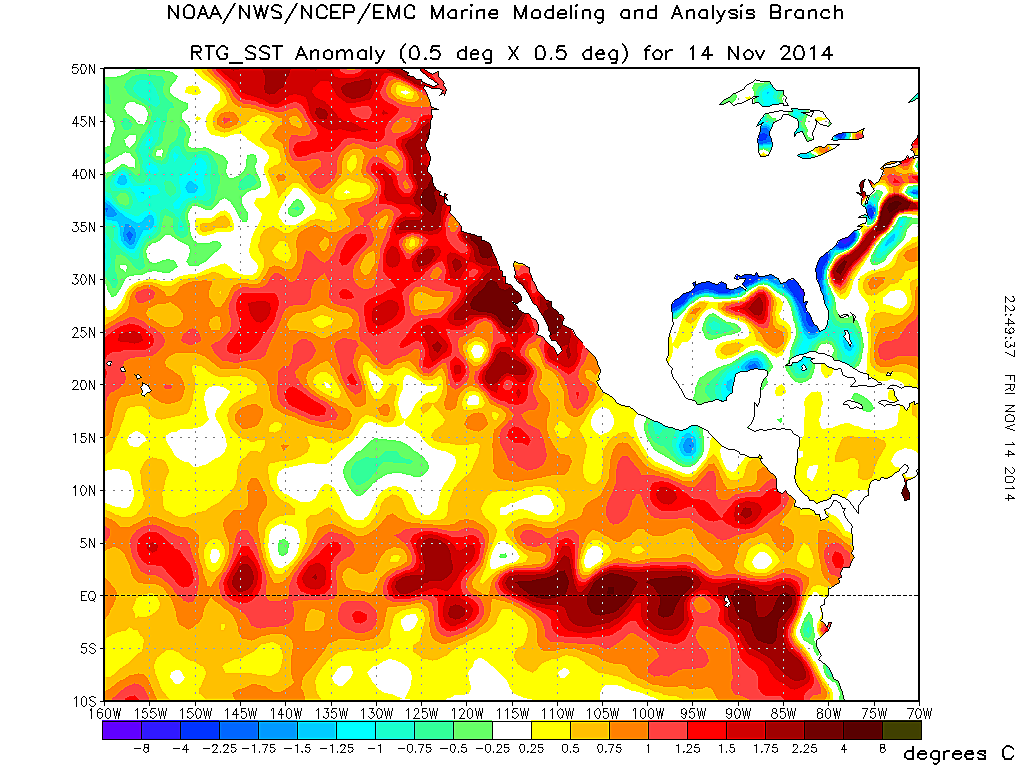
Pacific Ocean conditions remain rather odd, with a huge region of above-normal SSTs persisting and even intensifying along the West Coast (and the North Pacific warm “Blob” appears to be making a bit of a comeback in recent days). Since these patterns of SST anomalies are not typical of a canonical El Nino regime, it’s a little less clear how the atmosphere might respond for the remainder of winter. An educated guess might be that the subtropical jet in the Central Pacific might be stronger than usual due to the enhanced SST gradient at that longitude, though the uniformly very warm SSTs further east make it harder to say what might happen along the West Coast and in California in particular. In short: much uncertainty remains, though we can be certain that we’re had a relatively dry start to the wet season thus far.
A brief note regarding NCEP’s upcoming GFS model upgrade
The flagship American operational forecast model–the Global Forecast System (or GFS)–is scheduled to undergo a major upgrade in the coming weeks. In recent years, the forecast accuracy of the GFS relative to global numerical weather models from other international modeling centers has fallen considerably, and over the last year or so most meteorologists have considered the ECMWF–which is funded and operated by a consortium of European governments–to be the superior model. Weather models are among the most complex numerical models in the world, and are quite expensive to operate since they require the near-continuous use of supercomputers to produce real-time forecasts multiple times per day for each corner of the globe. In the United States, nearly all operational weather models are managed by the National Centers for Environmental Prediction, which is a subset of NOAA and is thus funded by taxpayer dollars. Interestingly, the funds for this particular GFS upgrade come from a federal-level disaster relief bill originally enacted as part of the emergency response to the damage caused by Superstorm Sandy in 2012.
The most significant changes in the new GFS are probably the doubling of its horizontal resolution–which is now as high as ~13 kilometers for the first 10 days of the forecast period–and the improvement of its data assimilation scheme (i.e. the model will use new satellite data to better ascertain what the initial state of the atmosphere/ocean is before it starts making a forecast). Both of these changes are quite substantial, and will hopefully lead to a noticeable improvement in forecast skill over time. These changes are scheduled to go into effect on December 17th, 2014.
© 2014 WEATHER WEST
Discover more from Weather West
Subscribe to get the latest posts sent to your email.