ARkStorm 2.0: Climate change is increasing the risk of a California megaflood
Note: This special Weather West article focuses on new peer-reviewed scientific research, co-led by Xingying Huang and me, that we recently published in the journal Science Advances. This research, as well as the following blog post distillation of it, represent the first phase of the ongoing ARkStorm 2.0 effort to better understand and characterize the risks associated with potentially catastrophic California floods in a warming climate.
What is ARkStorm 2.0?
In recent years, California has experienced more than its fair share of historically severe drought, water scarcity, and devastating wildfires. But delving back farther into the historical and geophysical record makes clear that the Golden State is also a region highly susceptible to occasional, but extraordinary, very large flood events. Such floods don’t happen every year; in fact, in the past they didn’t even occur every lifetime—large floods in the past half century or so, including the regionally devastating events in 1969, 1986, and 1997—still pale in comparison to those apparent in the paleoclimate record.
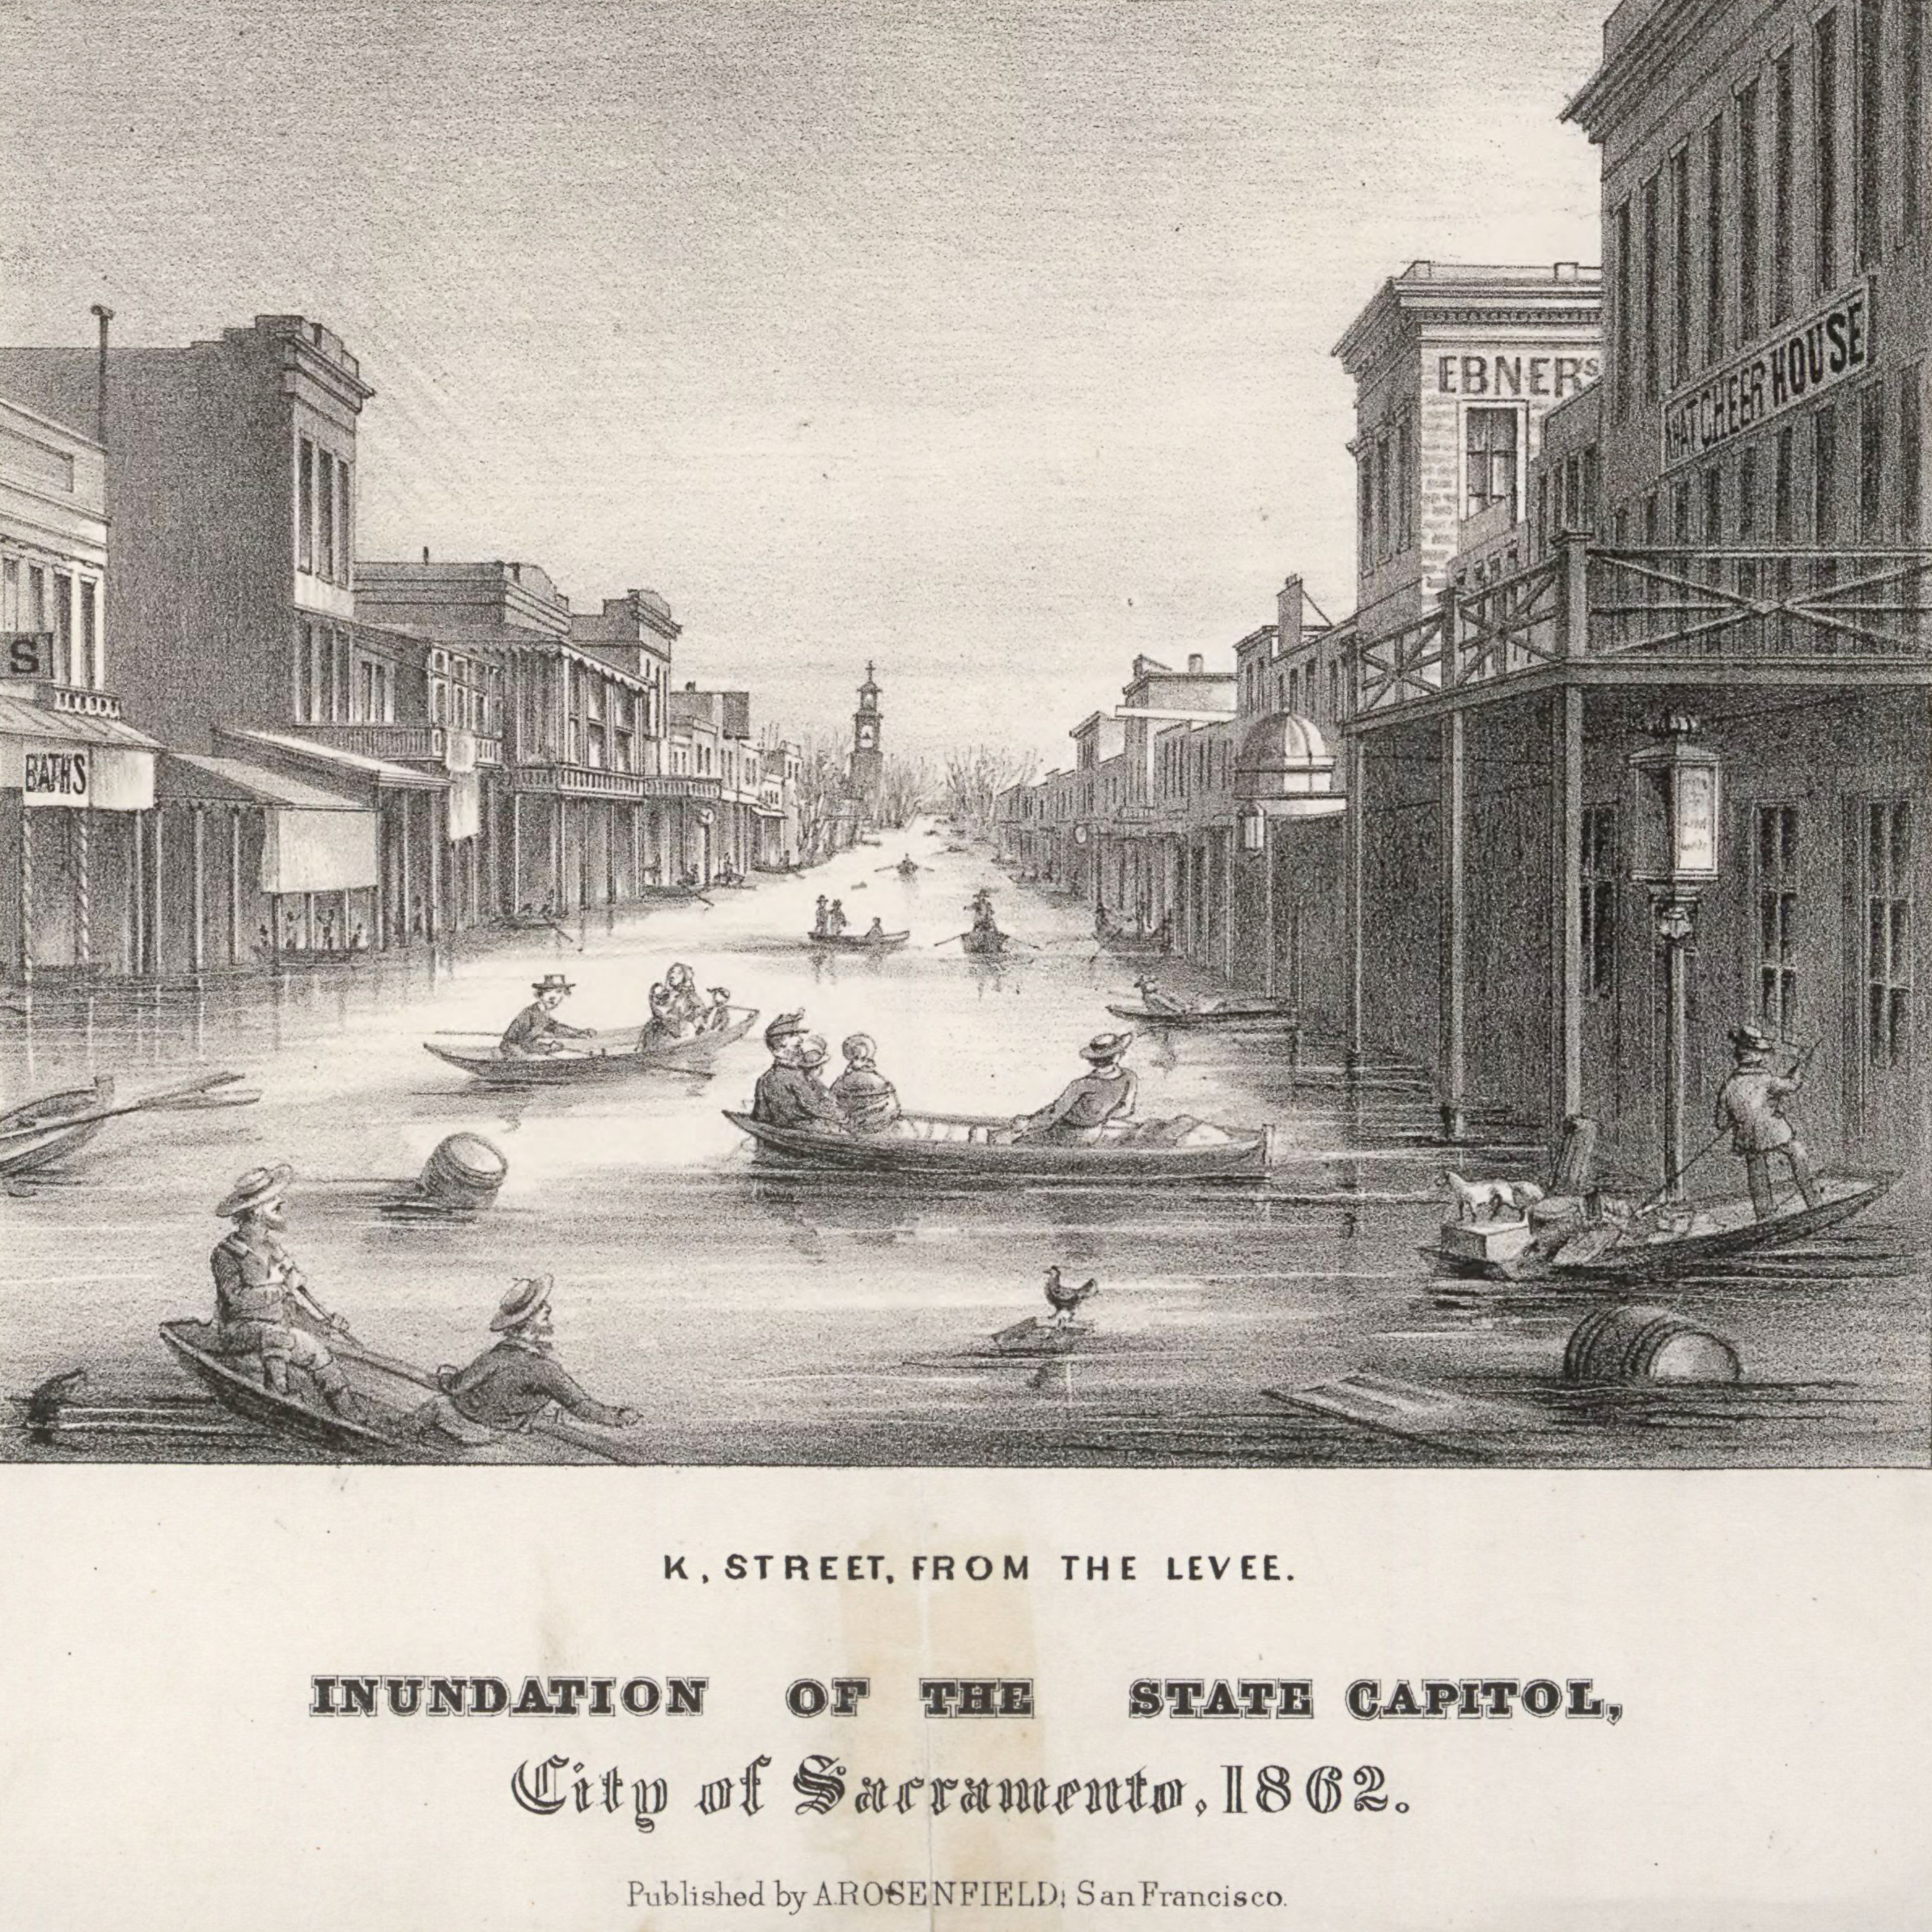
Perhaps the most obvious precedent for a California megaflood event occurred in 1861-1862, a multi-week super-soaker storm sequence that later came to be known as the “Great Flood of 1862” (GF1862). That event—which inundated vast swaths of the then-nascent state of California including a ~300 mile long stretch of the Central Valley, large portions of the modern-day Los Angeles metro, and virtually every narrow river valley throughout the state—is widely considered the benchmark for a “plausible worst case scenario” flood in contemporary California. (It is important to point out, though, that even 1862 is not the largest physically possible flood event in this region—there is evidence from coastal and bay river sediment deposits of multiple larger events in the past millennium.) It was precisely this event that provided the motivation for an extreme storm and catastrophic flood scenario back in 2011—known as “ARkStorm”—that was developed by a broad consortium of scientists from the USGS, University of California, Desert Research Institute, and other institutions. Ultimately, it was found that such a modern recurrence would result in widespread, catastrophic flooding throughout California—likely causing much greater damage, disruption, and economic losses than a large-magnitude earthquake near one of California’s major urban areas.
Building on the original ARkStorm scenario, we developed two brand new megastorm scenarios as part of “ARkStorm 2.0”: a historical (ARkHist) & warmer future scenario (ARkFuture) aimed at more systematically characterizing the plausible range of megastorm and extreme flood events that might befall California both in the present era and in the future. We wanted to revamp ARkStorm for two primary reasons. First, the original ARkStorm did not consider climate change, and recent evidence suggested that warming may be substantially altering the characteristics of and risks associated with such an event. Second, there have been numerous advances in climate, weather, and hydrologic science over the past decade or so that would allow for much more comprehensive and detailed assessment of the overall likelihood of such events as well as their local-scale details. So motivated, we spent the last few years coordinating research and experiments (with many of the original ARkStorm team members, plus some new folks)—and the paper discussed in this blog post represents the culmination of the extreme storm scenario design and implementation, which I co-led along with Xingying Huang. Future phases of ARkStorm 2.0 (briefly discussed at the end of this post) will be led by other team members, and work on this project and its integration into policy and planning efforts will likely continue for at least several years to come.
ARkStorm 2.0 megastorm scenarios: Historic, and then some
For ARkStorm 2.0, we wanted to use the latest science and modeling tools to develop physically realistic month-long megastorm and subsequent potential megaflood scenarios for California. In ARkStorm 1.0, the underlying atmospheric scenario was composed of a synthetic concatenation of two severe historical regional California flood events in 1969 and 1986, plus an extra day of storm stalling for good measure. This provided ample opportunity to explore the consequences of an extremely wet storm sequence in California, but it remained unclear whether a stalling storm sequence like this was actually plausible in the real world. So for ARkStorm 2.0, we did not limit our investigation to the historical record. Instead, we leveraged an existing climate model large ensemble (CESM-LENS) that includes 40 independent replications of both the 20th century and the projected future (21st century). That allowed use to explore a much larger “synthetic” sample size composed of hundreds of model-years for both the present and future era—giving us a better sense of the types of month-long storm sequences that are plausible on multi-centennial timescales.
From there, we selected our ARkHist and ARkFuture scenarios from among the top three 30-day statewide precipitation accumulations in both the present and warmer future eras. We then embedded a high-resolution weather model (WRF with grid boxes 3km on a side) within the climate model data to produce detailed “synthetic weather forecasts” for California during both scenarios. These high-resolution weather-within-climate model simulations are the basis for most of the discussion that follows.
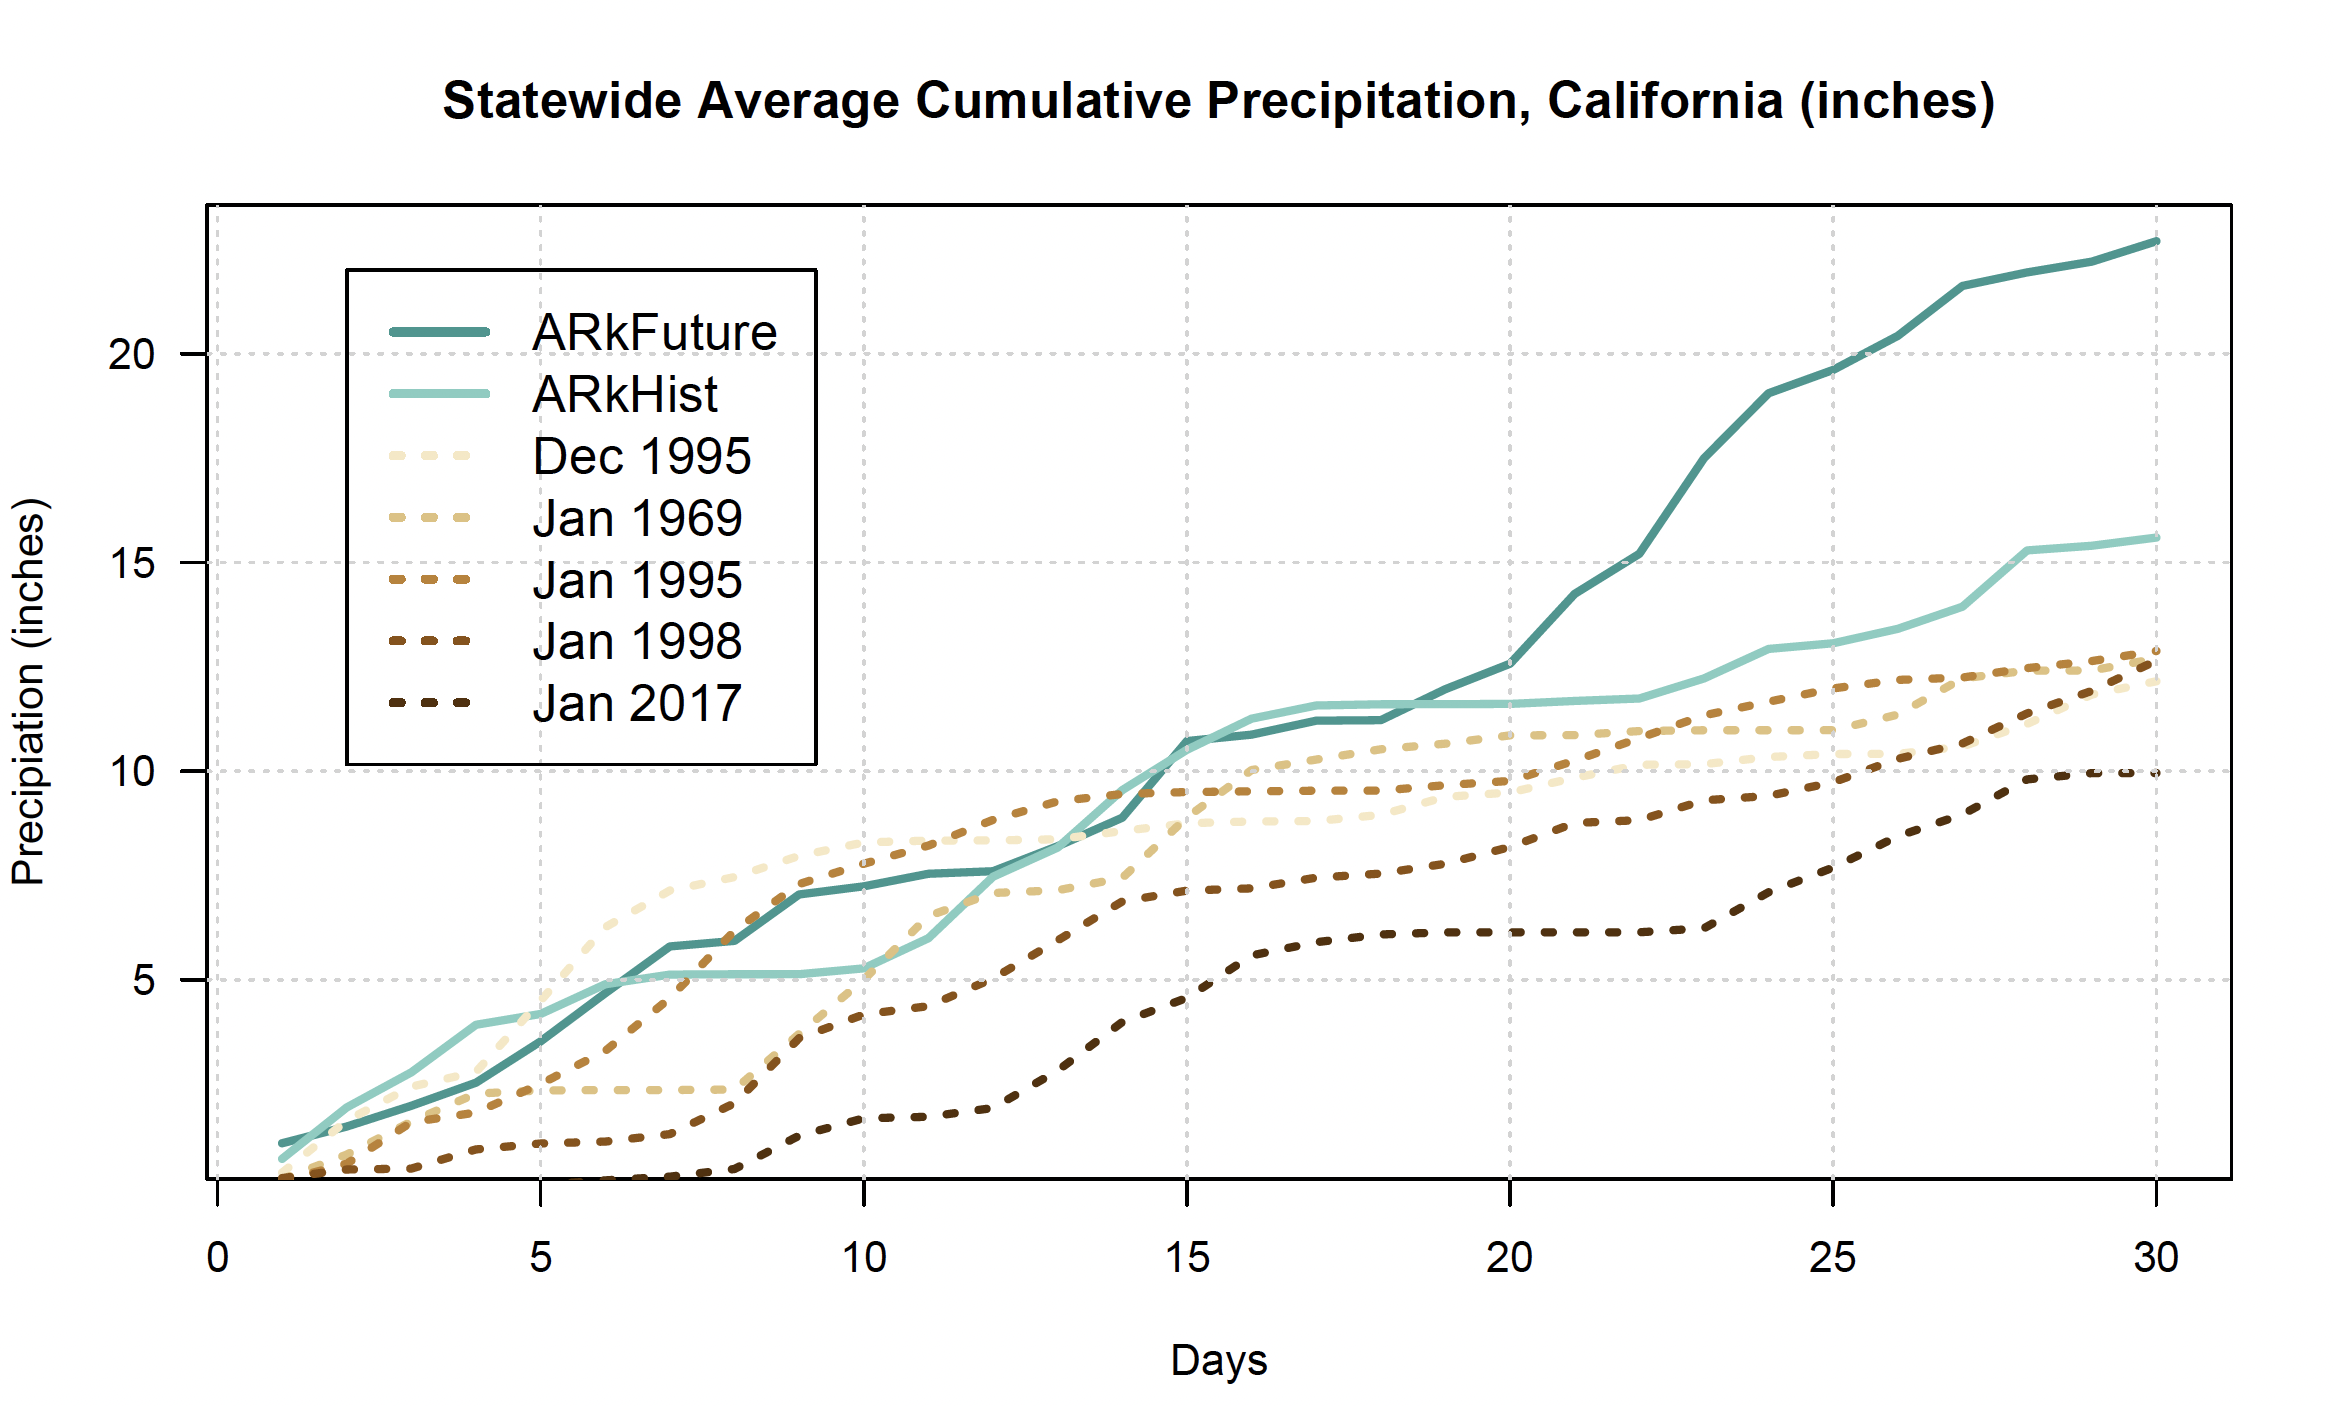
We find that both ARkHist and ARkFuture scenarios would bring an extreme amount of precipitation to nearly all of California, though the ARkFuture scenario would be considerably worse. When compared to all historical 30-day statewide precipitation accumulations going back to the early 1950s, ARkHist exceeds them all (though by a relatively modest amount), and brings slightly less precipitation than was likely observed during the wettest 30-day period of the Great Flood of 1862. ARkFuture brings dramatically more precipitation than anything observed in California over the past century, and likely exceeds the precipitation observed in 1862 by some margin. Using the full climate model ensemble, we estimate that ARkHist has about a ~90-100 year recurrence interval in the 1995-2005 era climate; ARkFuture-level events did not occur in the historical climate so likely have recurrence intervals exceeding 400 years in the 1996-2005 climate. Hence, our two scenarios can qualitatively be interpreted as “extreme” and “very extreme,” respectively.
(We also note that we define these scenarios on the basis of statewide average cumulative precipitation. This means that historical comparisons are only approximate, since impacts in specific watersheds could very well be either much greater or much less than more regionally-focused historical events.)
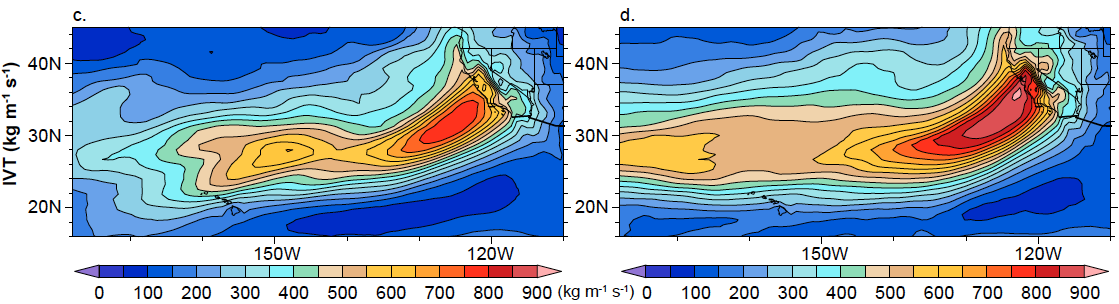
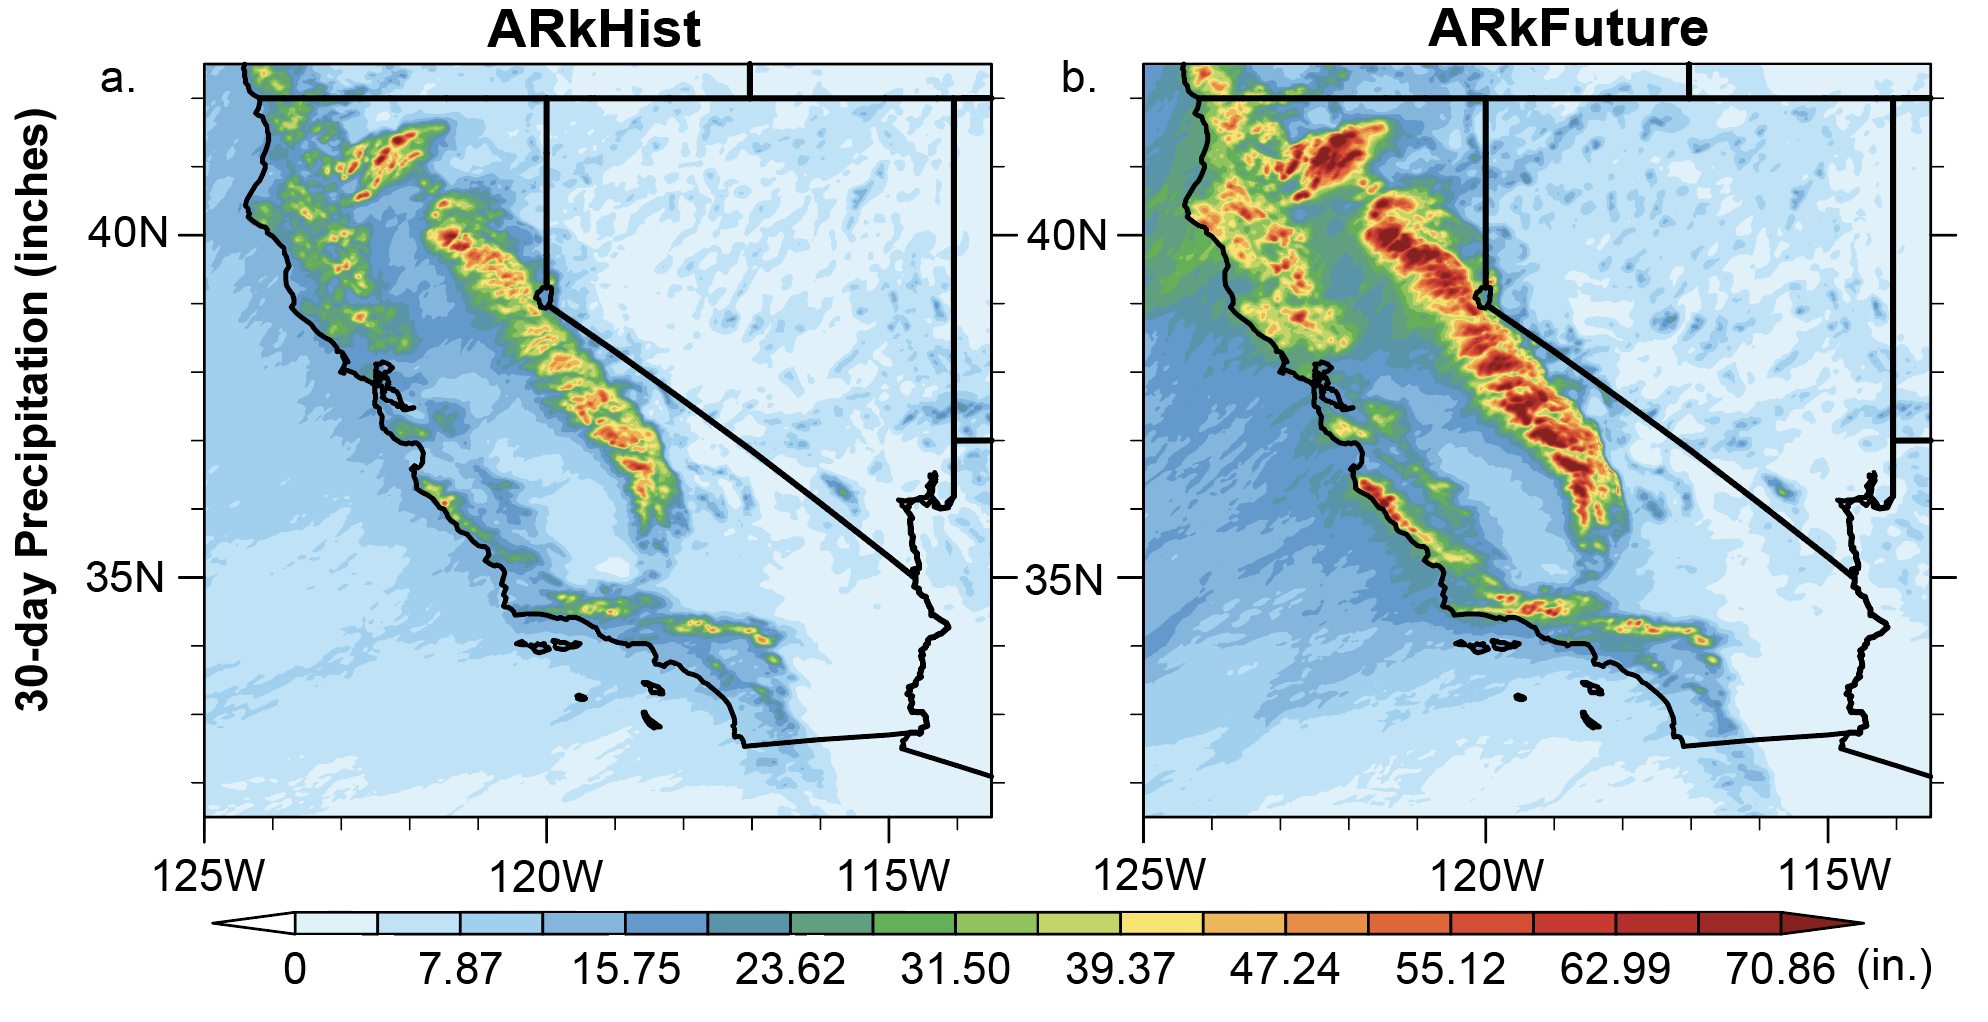
Both ARkHist and ARkFuture feature a weeks-long parade of atmospheric river (AR) storms during the winter months. Some of these are fairly cold ARs; others are very warm events with deep subtropical connections (i.e., classic “Pineapple Express”-type storms). Over the course of 30 days, these storms bring phenomenal amounts of precipitation. In ARkHist, much of the Sierra Nevada sees 40-55 inches of liquid equivalent (with a maximum of about 85 inches!); the Coast Ranges generally see 25-35 inches; and the Central Valley 10-25 inches; and Southern California anywhere from 15-25 inches along the coast to 25-35 inches in the Transverse Ranges. In ARkFuture, precipitation accumulations are even higher: much of the Sierra Nevada sees 55-70 inches of liquid equivalent (with a maximum of about 126 inches!!); the Coast Ranges generally see 30-45 inches; and the Central Valley 15-35 inches; and Southern California anywhere from 20-35 inches along the coast to 40-55 inches in the Transverse Ranges. Overall, on a statewide basis, precipitation during ARkFuture is about 45% higher than during ARkHist. Although the largest absolute precipitation increases in ARkFuture occur where you would expect (in already wet, orographically favored mountain areas), the largest relative increases actually occur elsewhere—often in low-elevation and historically rain-shadowed areas. Incredibly, these amounts would represent fully 60% and 71% of California’s average precipitation for the entire Water Year in just 30 days!
In addition to these enormous 30 day precipitation accumulations, we also find that these events would bring especially high precipitation intensities (that is, very heavy precipitation during a single hour or day). In ARkHist, at least 8 of 30 days are considered “heavy precipitation days” (HPDs) in coastal areas, and at least 14 of 30 days in mountain areas; in ARkFuture, HPDs increase to 16 days in coastal areas and 20 days in mountain areas (with some parts of the Sierra Nevada and southern Cascades seeing an astonishing 30 of 30 HPDs). But we find even larger increases in the occurrence of “heavy precipitation hours” (HPH): a ~220% increase in HPHs statewide, and a northward shift in the maximally affected region from the southern California Transverse Ranges to the Sierra Nevada and Santa Lucia Mountains. These very large increases in extremely heavy precipitation days and hours would have major implications for flash flood and debris flow risk—especially in a state simultaneously experiencing a large increase in large and intense wildfire activity (which greatly amplifies the risk of both such hydrologic hazards).
Very large increases in mountain runoff due to warming storms
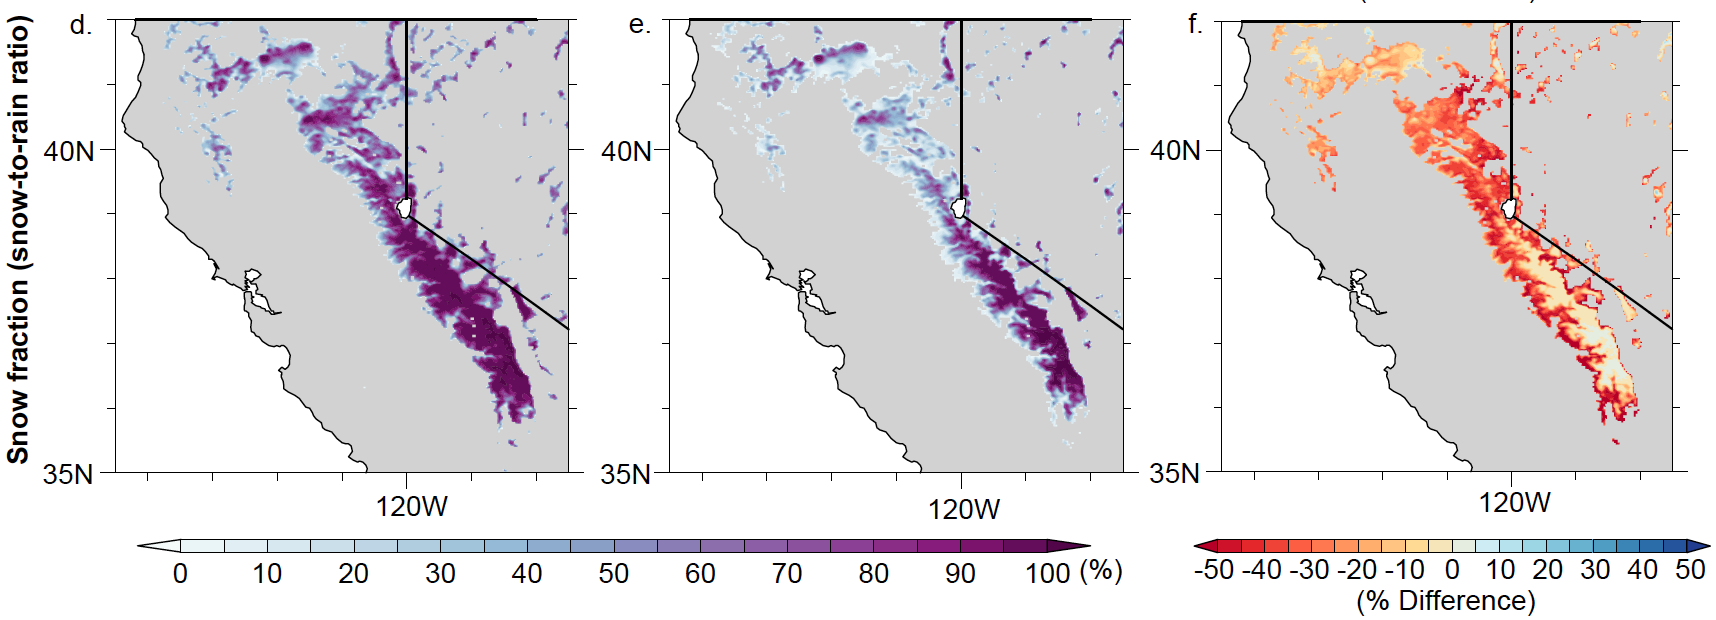
We also consider the thermal profiles of these megastorm events in these scenarios, and their implications for snowpack and subsequent runoff. At the very highest elevations of the Sierra Nevada, both present (and, somewhat strikingly, even future) scenarios produce truly enormous snowfalls. Above about 9,500 feet elevation, a few areas receive over 3 feet of snow water equivalent (SWE) during ARkHist—translating into 23-25 feet of actual snowfall (!!). But since some melting does occur during warmer phases of the storm (including some rain-on-snow events), the maximum SWE “on the ground” is 12-15 inches liquid equivalent—likely translating to well over 100 inches of actual snow depth in these locations. In the historical scenario, there is also very heavy snow accumulation down to about 5,000 feet in elevation (with a few bursts of snow to much lower elevations).
In ARkFuture, we find major changes in mountain snowfall patterns due to warming temperatures and increased freezing levels. The primary precipitation type during the 30 day period shifts from snow (ARkHist) to rain (ARkFuture) at lower to middle elevations (4,000 – 6,500 feet), but remains primarily snow above about 7,000 feet. This results in an interesting “dipole” pattern of snowfall changes, with large or total (>50%) disappearance of snow accumulation as high as 6,500 feet but large increases in snow accumulations at very high elevations (above 8,000-9,000 feet) due to greatly increased moisture and temperatures that are just cold enough for snow. (In ARkFuture, a few isolated and remote peaks at the highest elevations of the southern Sierra Nevada accumulate around 70 inches of liquid equivalent SWE—translating to over 30 feet of exceptionally wet and heavy (~5:1 ratio) snowfall).
As we have experienced as recently as December 2021, exceptionally heavy snowfalls in the Sierra Nevada can cause significant transportation and infrastructure damage in their own right—so this appears to be a continued consideration at relatively high elevations even in a much warmer climate (and certainly so in the present climate).
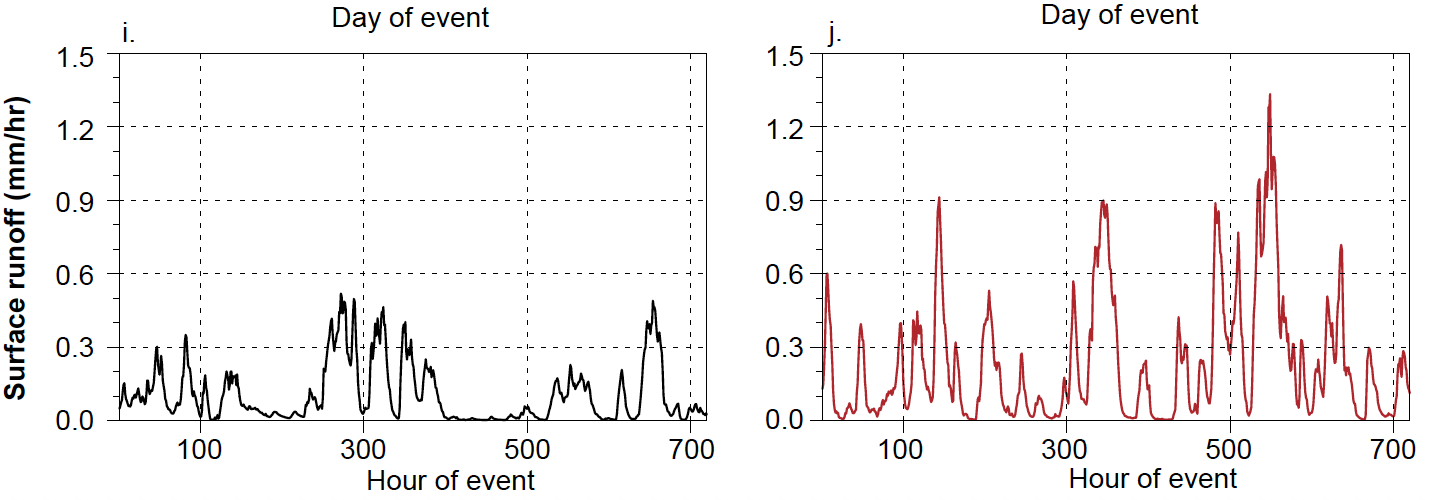
But the primary concern with these future snow changes in ARkFuture relative to ARkHist is the implications for greatly increased runoff into rivers and streams—and subsequent increases in flood risk. And, indeed, we find exceptionally large increases in runoff during ARkFuture that greatly exceed precipitation increases, especially within watersheds draining the western slopes of the Sierra Nevada. In the Sacramento and San Joaquin watersheds, peak ARkFuture runoff is as much as 200-400% higher than ARkHist runoff (despite precipitation totals that are “only” ~50% higher). We attribute this directly to the increased instantaneous runoff from precipitation, which in the future scenario falls primarily as liquid rain vs. solid, accumulative snow to elevations as high as ~6,500 feet (or higher, during some portions of the storm). There is also evidence of multiple potential “rain-on-snow” events at higher elevations, which could further add to the runoff burden. Elsewhere in the state, peak runoff also increases by a considerably wider margin than does precipitation (runoff increases of 60-100% everywhere except the southeastern deserts vs. precipitation increases of 30-60%).
Altogether, it appears that the plausible worst case scenario storms in a warming climate are likely to produce massive precipitation accumulations, but even more exceptional runoff in relative terms due to profound changes in mountain hydrology brought about by decreasing snow fraction (something co-lead author Xingying Huang and colleagues previously termed the “Double Whammy Effect”). This has particularly large implications for the Sacramento and San Joaquin River flood plains (as well as their upstream tributaries)—a part of the state where millions of Californians now live atop ancient flood deposits. Flood risk during an event like either of these scenarios will bring widespread and severe flood risk to nearly the entire state, but the extreme increases in projected surface runoff in the Sacramento and San Joaquin basins are of particular concern given the confluence of high pre-existing risk in these regions and a large population that has never experienced flooding of this magnitude historically.
Megastorm risk appears higher during moderate-strong El Niño conditions
There has been much discussion over the years, both within and outside of the scientific literature, regarding the linkage between El Niño/Southern Oscillation (ENSO) and California hydroclimate. Some observers have recently claimed that ENSO’s influence on California rainfall has been overstated—and, if one considers only simple correlations and long-term average relationships between simple ENSO metrics and California precipitation, there is perhaps some truth to these claims.
However, a new wave of research using more sophisticated and physically-based metrics of ENSO intensity (i.e., measuring the actual longitudinal position of enhanced tropical convection (thunderstorms) that drive ENSO-related shifts in the jet stream, via a new metric called the ENSO Longitude Index (ELI) rather than ocean temperatures alone) has recently led to considerable advances in this area. To make a long story short: it turns out that ENSO is indeed a very important (likely the single most important!) discernable predictor of California hydroclimate on seasonal and even multi-annual timescales. But this relationship is asymmetric: El Niño has a more consistent relationship to CA hydroclimate than does La Niña, and the strength of this relationship is itself non-linear: weak ENSO events generate little if any meaningful signal, but moderate to strong ones generate a substantial signal (especially when one increases the sample size of such intense events beyond what is available using the observational record alone by using climate models and various climate proxies).
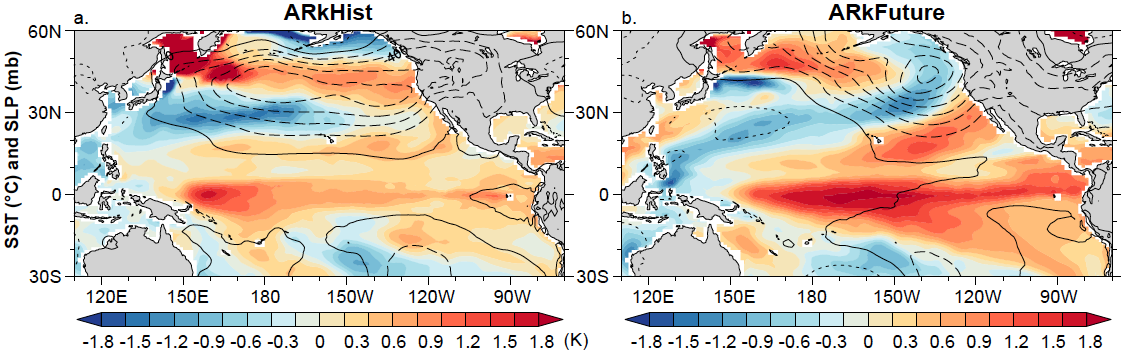
What does this mean in the context of ARkStorm 2.0? Well, it turns out that both ARkHist and ARkFure scenarios occur during warm ENSO (El Niño) events. But that’s just a sample size of 2, which is not especially meaningful. So, we considered all of the top 4 events during both the historical and future climate periods in the climate model large ensemble. And this is where things get interesting: all eight of the largest simulated 30-day “megastorm” events occurred during El Niño conditions of some magnitude—and 7 out of 8 of these occurred during moderate to strong El Niño events (as defined by the ELI). Interestingly, many of these El Niño events had more of a central Pacific-focus than an East Pacific-focus—suggesting that so-called El Niño Modoki events may, perhaps, increase the risk of such events even more than more traditional East Pacific-centered events.
But the most striking aspect of this piece of the analysis is this: the fact that nearly all simulated 30-day megastorm events occur during moderate to strong El Niño events (as defined using a physically-based metric) suggests that there may already be some enhanced predictability of such events at seasonal scales, as existing models are often able to make skillful predictions of cool-season ENSO conditions with 2-6 months of lead time. It also means that California megaflood events may preferentially occur during already wet Water Years (given the relatively strong correlation between moderate-strong El Niño and unusually wet conditions in California)–which would further amplify flood risk due to wet antecedent soil conditions. So the next time seasonal predictive models are predicting a high likelihood of a strong El Niño event, I would strongly advise water and flood emergency managers to pay close attention!
Climate change is rapidly increasing the risk of a California megaflood
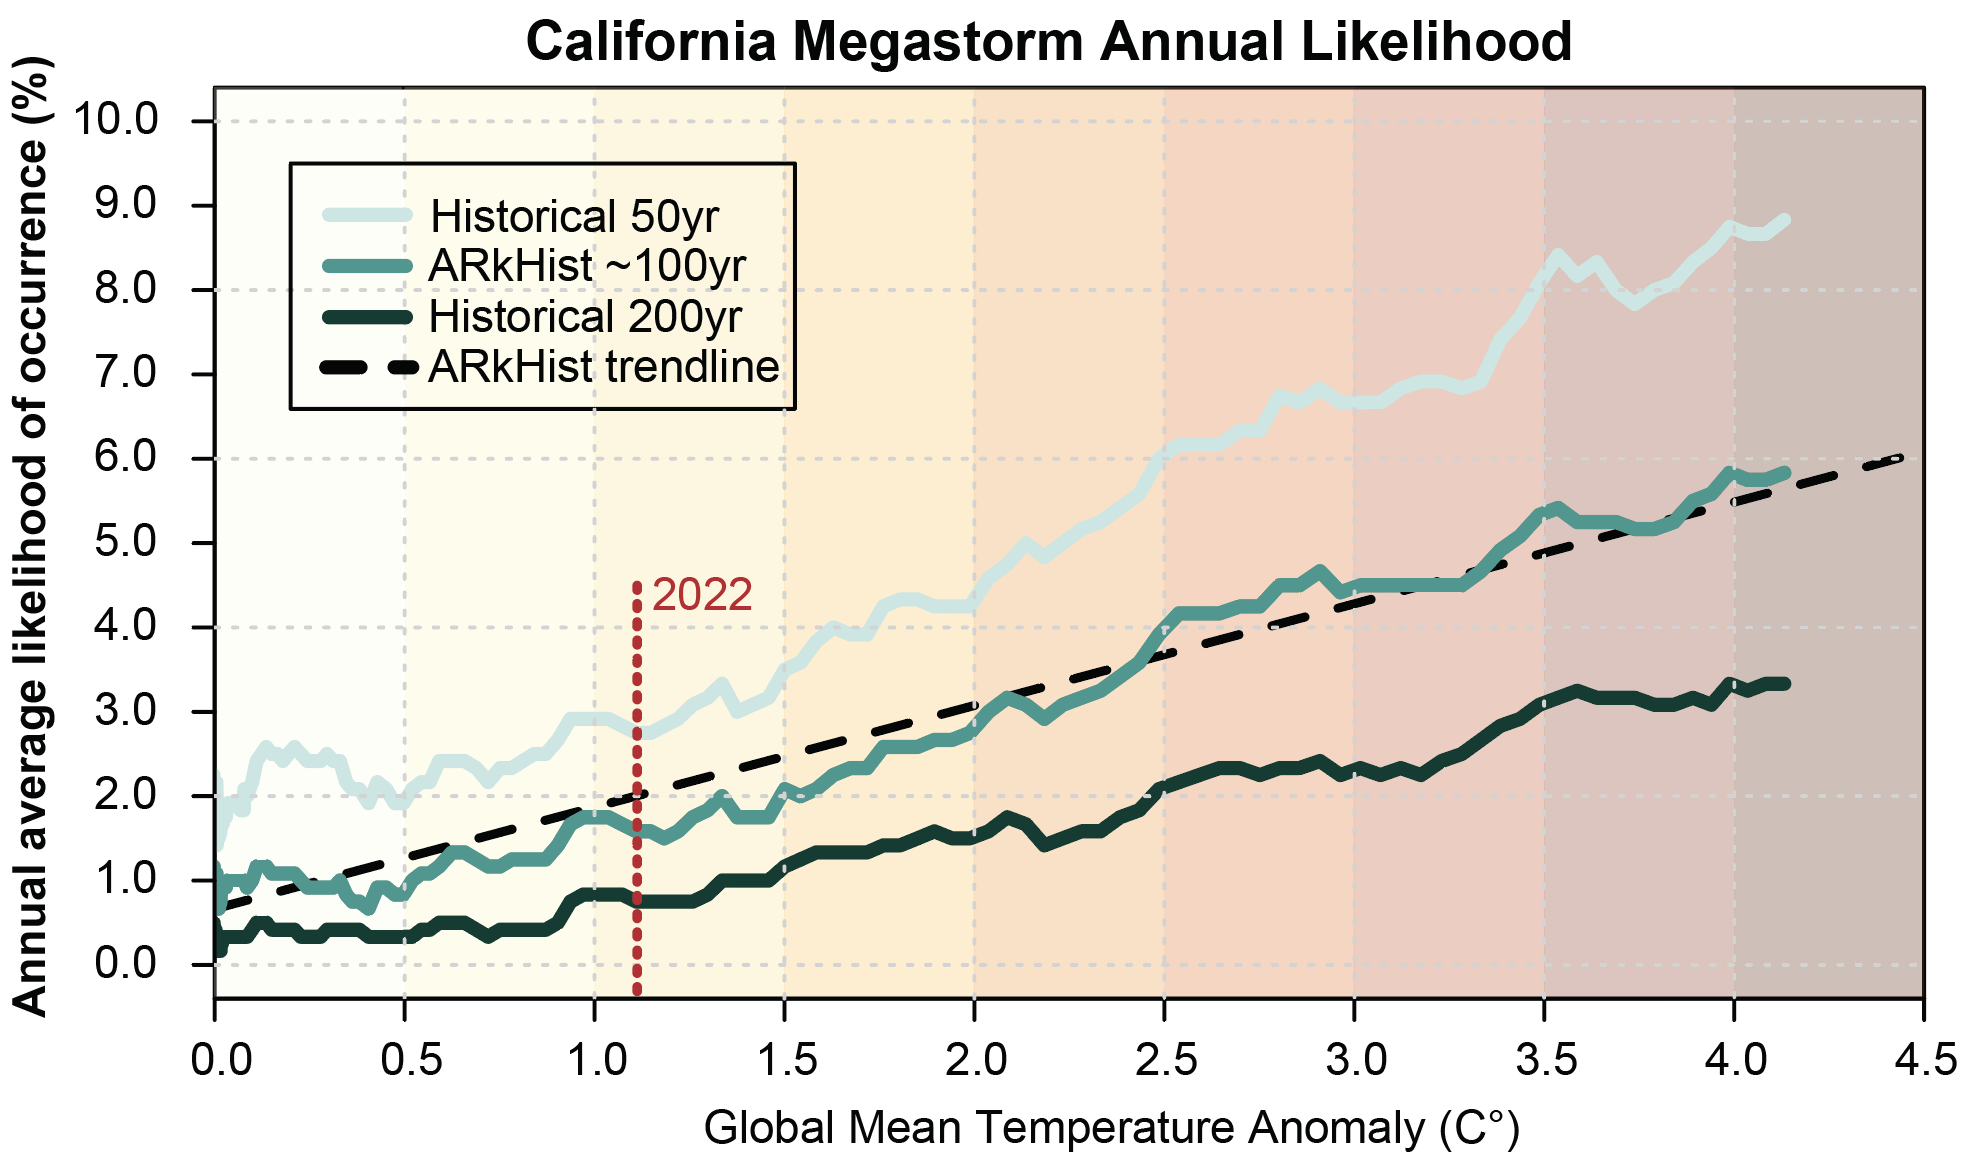
In addition to examining the fine-scale details of our ARkHist and ARkFuture “synthetic weather forecasts,” we also consider the broader role of climate change in influencing the occurrence of such megastorm events at different levels of warming using data from the full climate model large ensemble. For an ARkHist level event, we find that historical climate change has already doubled the risk of a present-day megastorm. For an even more extreme event with a historical era recurrence interval of ~200 years (thought to be close to the level of the GF1862), climate change to date has more than tripled the risk relative to a century ago. We further find that each additional 0.5 to 1°C of global warming (we’ve already seen around 1.1-1.2°C of warming since the 1800s) will result in a continued steady increase in risk beyond what has already occurred.
And while it’s not clear, at this point, exactly how much the Earth will warm in the coming decades—an uncertainty stemming mainly from the many possible future trajectories of carbon emissions due to socioeconomic and political shifts, rather than Earth system uncertainties—currently proposed emission reduction targets would likely result in an additional 1-1.5°C of warming beyond what we’ve already seen. So it is highly likely, at this point, that California will experience further large increases in the risk of megastorm events capable of producing megaflood conditions. Just how much that risk increases is still largely up to us, as a global society—but since substantial increases are likely even in optimistic low-to-moderate warming futures, adapting to this increasing risk is becoming critically important.
It’s important to remember that California megafloods have occurred since time immemorial; we don’t need to invoke climate change to know that exceptional pluvials can certainly occur in this part of the world—even in a cooler climate uninfluenced by humans. But climate change is dramatically upping the odds of a very high magnitude flood event happening in our lifetimes, specifically.
Megafloods in an era of megadrought: a manifestation of hydroclimate whiplash
The apparent irony of publishing research on the growing risk of a California megaflood in the midst of a severe drought is not lost on the authors (or our fellow ARkStorm 2.0 collaborators). Indeed, California has endured historically severe droughts on two separate occasions in the past decade, as well as a dramatic escalation of its wildfire situation. California’s disaster preparedness and climate adaptation activities, at the present time, are (understandably) focused primarily on drought, water scarcity, and wildfire-related hazards. And the Colorado River Basin water crisis is presently accelerating under what can now be considered long-term “megadrought” conditions.
But in the same decade that California has experienced its driest Water Years, calendar years, winters, and longest dry spells record—the northern part of the state has also experienced its wettest Water Year on record and in many spots its single wettest calendar days on record. So our renewed focus on severe flood risk is, perhaps, less out of left field than it might appear at first glance. Indeed, recent work by other scientists suggests that natural climate variability over the past few decades has masked a latent increase in Western flood risk brought about by climate change. Our work strongly supports this notion in California, and suggests that it’s only a matter of time before this latent increase in severe flood risk becomes “unmasked” in the Golden State.
Ultimately, all of these extremes at opposite ends of the hydroclimate spectrum are another manifestation of the “hydroclimate whiplash” that I discuss so often on Weather West and in our own scientific research. We’ve recently been experiencing a lot of drought and water scarcity one end of that spectrum, but at some point the pendulum will swing back in the other direction (with some extra vigor contributed by human-caused warming of the climate system). It’s impossible to predict exactly when that will occur, but it’s essentially inevitable in the long run.
All of this may sound a bit complicated—and it is! But understanding and digesting this climate nuance is ultimately of great practical importance if California is to preserve (and improve) its climate resilience in the coming years and decades. Adapting to increasingly wide swings of the hydroclimate pendulum—meaning both more drought risk and more flood risk—is different than adapting to a climate that is either a drying or wetting. Is a warmer future California likely to be wetter or drier? The answer, to the best of our current knowledge, is…both.
This means that California’s water and flood management policies and infrastructure will have to be substantially revamped for our brave new 21st century climate. Not only do we have to adapt to increasing water scarcity due to increasing atmospheric evaporative demand and declining snowpacks, but we also have to deal with the sharply increasing risk of large flood events and increasing precipitation intensity (if and when the rains do fall). In the long run, this will likely require substantially re-tooling our existing water storage and conveyance infrastructure to accommodate both deeper droughts and larger floods. And some of the most promising ways of doing that involve a portfolio of solutions centered on things like enhanced groundwater sustainability (including flood-managed aquifer recharge (FloodMAR), whereby occasional flood flows are opportunistically diverted to recharge basins to simultaneously reduce the risk of short-term urban inundation and hedge against future droughts) and dynamic flood management (including large- and small-scale floodplain restoration, river bypasses, forecast-informed reservoir operations (FIRO), and more). Flexibility will be the name of the game in California’s wetter, wilder hydroclimate regime. Much of this, of course, is easier said than done. But in the long run, it’s something that the changing climate system makes inevitable: it’s just a question of whether we make these changes preemptively on our own terms, or wait for an especially extreme event to come along and make those decisions for us—suddenly, and perhaps catastrophically.
What’s next for ARkStorm 2.0?
The research discussed in this paper and associated blog post represents just the first phase of ARkStorm 2.0 project. Our multi-disciplinary team including experts from across the University of California system, the Desert Research Institute, the U.S. Geological Survey, and the National Center for Atmospheric Research continues to move forward with both research and integration of the underlying science and scenarios into public policy and disaster preparedness entities at local, state, and national levels. The project’s next phase, with the support of the California Department of Water Resources and Oak Ridge National Lab, will be a deep dive into the actual hydrologic and flood inundation conditions associated with our ARkHist and ARkFuture scenarios, answering the all-important question of “who, exactly, would get flooded in these megastorm scenarios—and how deeply, and for how long?” Doing this comprehensively and accurately for every square inch of California is a considerable endeavor that has never been attempted historically, so I’m thrilled our State of CA and federal partners are up to the task. Following that, the third phase of ARkStorm 2.0 will be deeper integration with policymakers and emergency responders to improve community resilience to and preparedness for extreme flood events in a warming climate. So please do stay tuned for future updates, which I’ll continue to discuss here on Weather West, on Twitter, and in the broader media sphere.
How is this article different from typical Weather West blog posts?
This special Weather West article focuses on peer-reviewed scientific research that my colleagues and I recently published in Science Advances, and also discusses peer-reviewed work by other scientists. This means that the content of this piece is based upon findings from formal scientific investigations by teams of researchers, which contrasts with more typical Weather West posts that are primarily based upon my own informal thoughts and analysis.
I would like to thank my co-lead author in this work, Xingying Huang, whose contributions to this research go back several years—as well as the growing cadre of ARkStorm 2.0 scientists and collaborators, including Dale Cox, Maureen McCarthy, Christine Albano, Mike Anderson, Kathy Schaefer, Kristin Ludwig, and Anne Wein. Support for my contribution to this research was provided through a partnership between UCLA’s Institute of the Environment and Sustainability, the Capacity Center for Climate and Weather Extremes at the National Center for Atmospheric Research, and The Nature Conservancy of California. This research was also generously supported by the Yuba Water Agency and the California Department of Water Resources.
A fully open-access version of this paper (freely accessible to all!) can be viewed here (Huang and Swain 2022).
Citation: Huang, X.Y.* and D.L. Swain*. “Climate change is increasing the risk of a California megaflood.” Science Advances, doi: 10.1126/sciadv.abq0995, 2022. (*Equal Contributions /Co-first authors)